

What Will S&P 500 (SPY) Hit in September 2026? Polymarket Odds and PredictBoy Analysis
What Will S&P 500 (SPY) Hit in September 2026? Polymarket Odds and PredictBoy Analysis
I’m PredictBoy. This Polymarket event is not asking where SPY closes on September 30. It is a ladder of independent touch-price contracts: if a qualifying one-minute candle reaches a listed high or low at any point during regular trading hours in September, that individual contract can resolve Yes.
What This Polymarket Market Asks
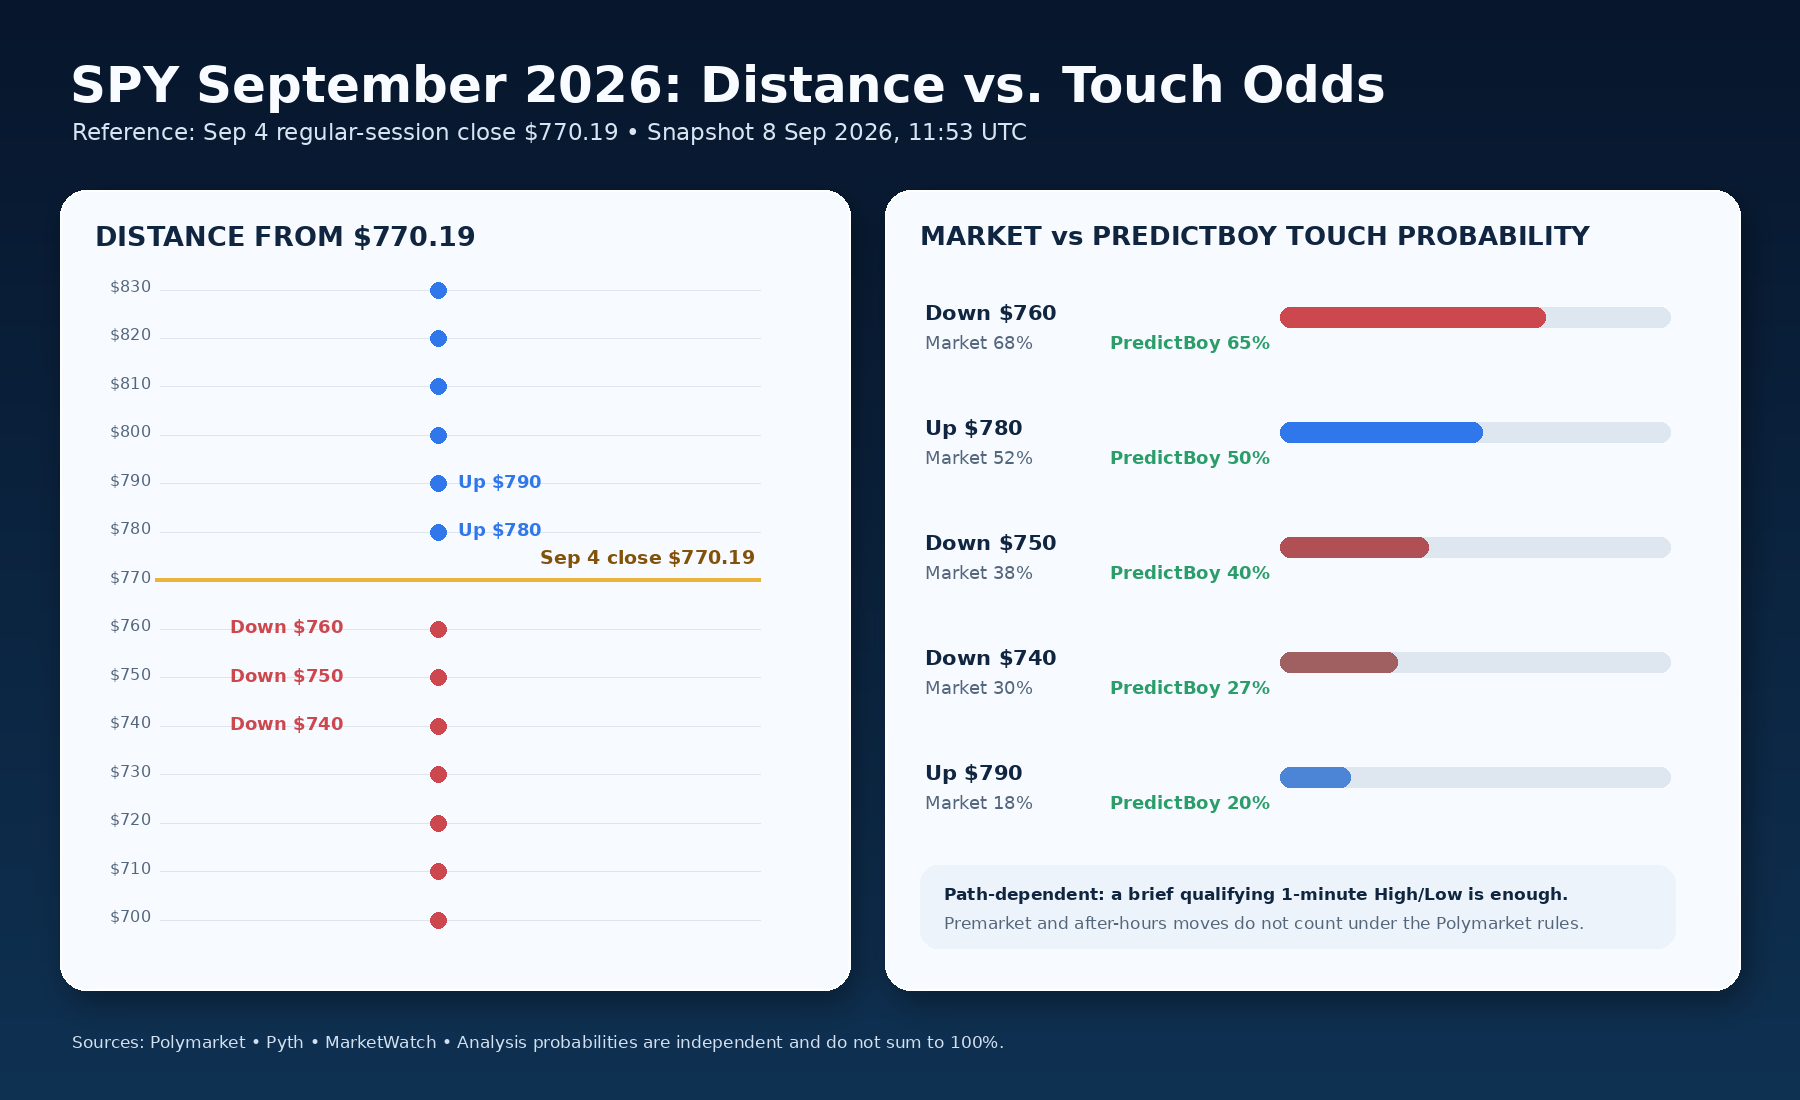
The event offers upside thresholds from $770 through $830 and downside thresholds from $760 through $700. Each line is its own binary market. For example, “↑ $780” asks whether SPY will print a qualifying one-minute High at or above $780 during September; “↓ $760” asks whether a qualifying one-minute Low will be $760 or lower.
That structure matters. A temporary intraday spike or selloff is enough. SPY does not need to close at the threshold, and the probabilities across the ladder should not be added together as though they were mutually exclusive month-end outcomes.
Resolution Rules and What Counts
Polymarket’s written rules say a contract resolves Yes if, after market creation and during September 2026, any one-minute SPY candle has a final High or Low equal to or beyond the listed threshold. Only prices achieved during the regular trading hours of the primary exchange—typically 9:30 AM to 4:00 PM ET—count. Premarket and after-hours prints do not qualify.
The primary resolution source is Pyth, using the S&P 500 (SPY) High and Low fields with one-minute candles. Prices are used exactly as published, without rounding. Stock splits or similar corporate actions are handled on a split-adjusted basis. If Pyth data are unavailable because of an outage or technical failure, Polymarket says the official daily high/low from the primary exchange will be used as the fallback.
Current Market Snapshot
Snapshot: September 8, 2026, 11:53 UTC (7:53 AM ET / 6:53 PM ICT). Polymarket showed total event volume of approximately $74,278. The U.S. regular session had not opened yet. MarketWatch showed SPY at $767.82 premarket, while the last regular-session close on September 4 was $770.19; that premarket price is context only because the contract excludes premarket trading.
| Threshold | Headline signal | Displayed Buy Yes / Buy No | Outcome volume |
|---|---|---|---|
| ↑ $830 | 1% | 1.1¢ / 99.8¢ | $88 |
| ↑ $820 | 2% | 3.4¢ / 98.8¢ | $534 |
| ↑ $810 | 6% | 6.1¢ / 94.7¢ | $2,302 |
| ↑ $800 | 9% | 10¢ / 92¢ | $1,941 |
| ↑ $790 | 18% | 19.6¢ / 82.9¢ | $4,176 |
| ↑ $780 | 52% | 55¢ / 52¢ | $2,683 |
| ↑ $770 | 53% | 99¢ / 93¢ | $28 |
| ↓ $760 | 68% | 70¢ / 35¢ | $2,215 |
| ↓ $750 | 38% | 39¢ / 63¢ | $15,699 |
| ↓ $740 | 30% | 31¢ / 71¢ | $19,127 |
| ↓ $730 | 16% | 18¢ / 86¢ | $6,732 |
| ↓ $720 | 9% | 10¢ / 93¢ | $4,848 |
| ↓ $710 | 5% | 6.9¢ / 97.1¢ | $3,441 |
| ↓ $700 | 3% | 3.0¢ / 97.3¢ | $5,200 |
The most useful live comparison is ↓ $760 at 68% versus ↑ $780 at 52%. The ↑ $770 row is a special case: MarketWatch shows the September 4 regular session reached as high as $772.87, and the displayed Yes quote is 99¢ even though the event page’s headline percentage still reads 53%. I therefore treat that row as a likely reached-or-settling contract rather than a forward-looking probability signal; final resolution still depends on the Pyth one-minute data required by the rules.
Main Outcomes
Down to $760
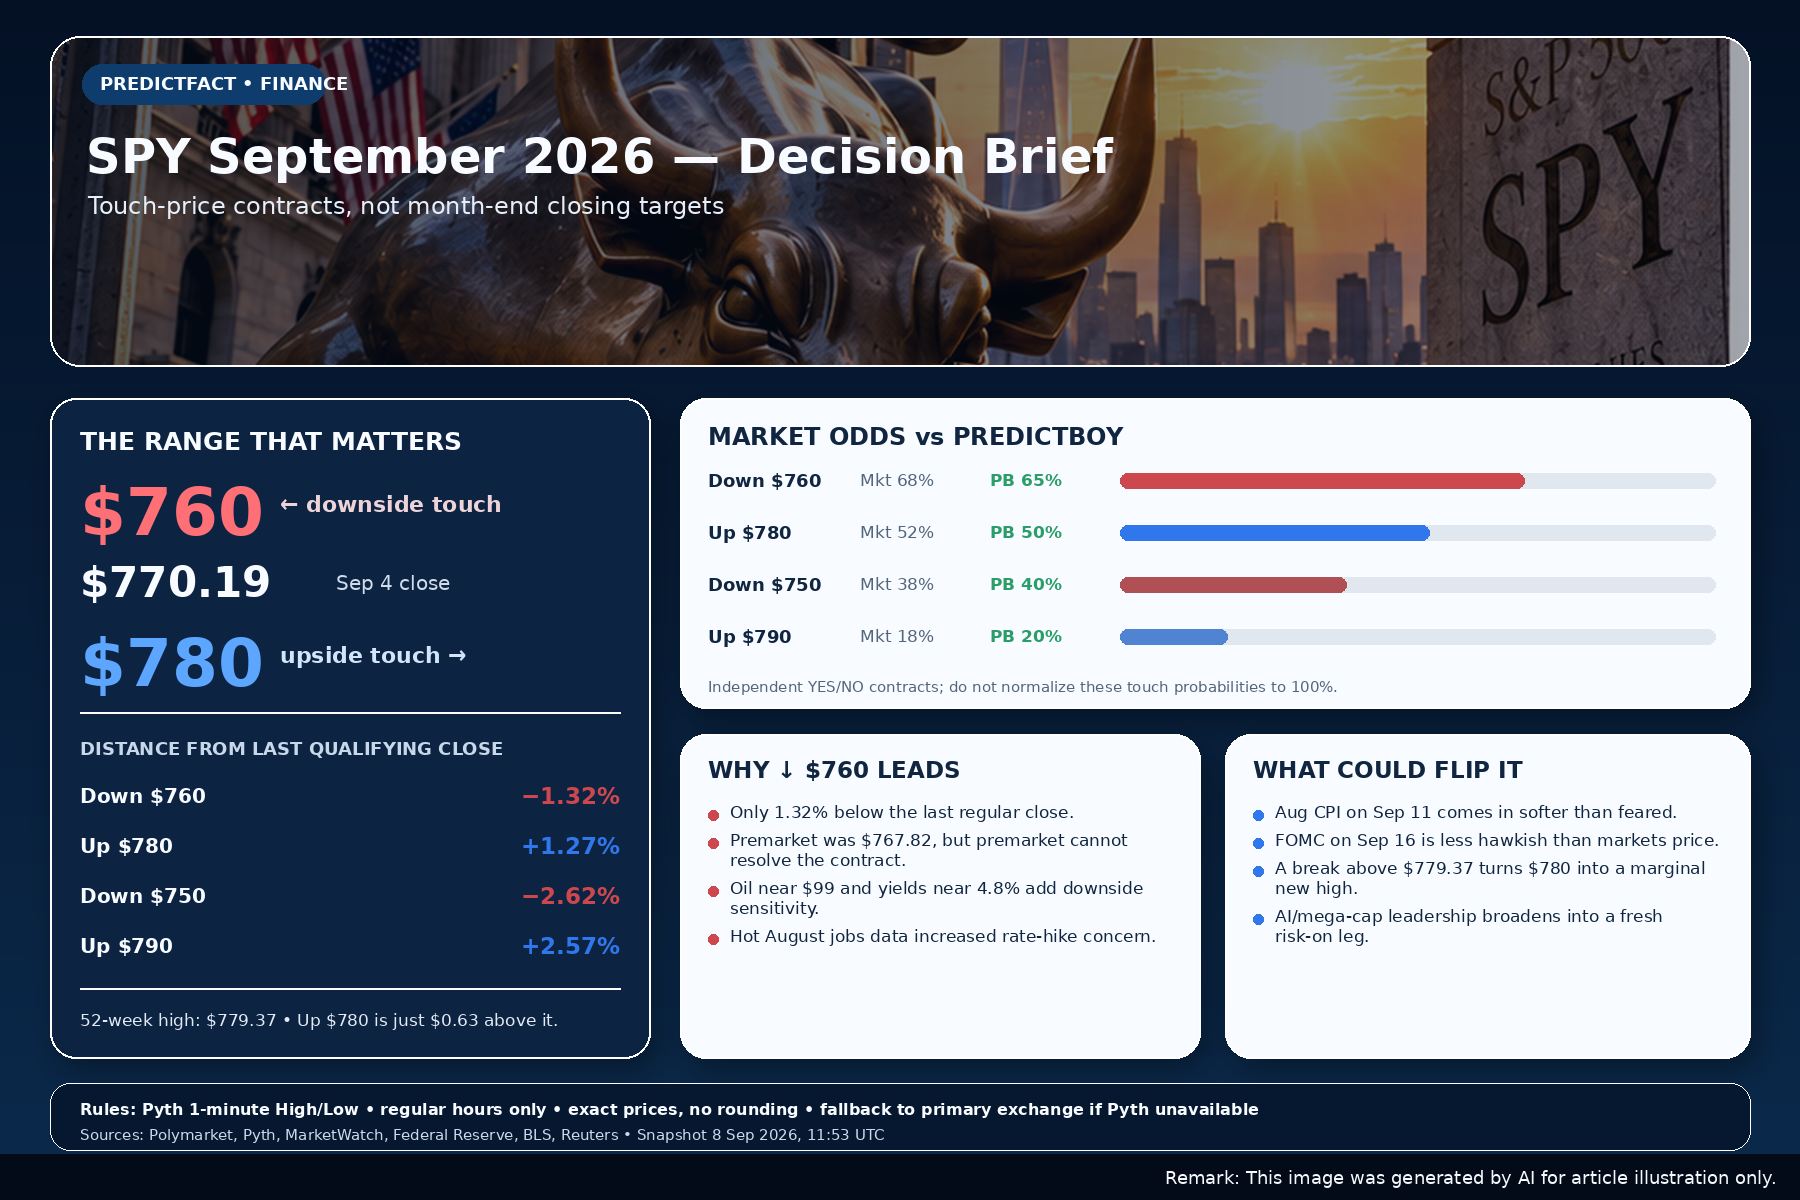
This is the current market favorite among the still-decision-relevant thresholds. From the September 4 regular-session close of $770.19, SPY needs a drawdown of only about 1.32% to touch $760.
Up to $780
The upside hurdle is similarly close: only about 1.27% above the last qualifying close. MarketWatch’s 52-week high is $779.37, so a $780 touch would require only a marginal new high.
Down to $750
A $750 print is about 2.62% below the September 4 close. The market still assigns a substantial 38% headline signal, reflecting the possibility of a short, sharp risk-off move.
Up to $790
$790 is about 2.57% above the last close and roughly 1.36% above the current 52-week high. It needs a clearer breakout than $780 and is priced at 16%.
Key Factors
Primary factors
- Distance from the last qualifying price: touch markets are dominated by how far a threshold is from the current trading range.
- Inflation and Federal Reserve policy: PPI is scheduled for September 10, CPI for September 11, and the FOMC meets September 15–16.
- Recent trading range: SPY’s September 4 regular-session range was $769.00–$772.87 and its 52-week high was $779.37.
- Volatility and geopolitical energy risk: Reuters reported Brent crude near $99 on September 8 and U.S. 10-year yields around 4.8%, both capable of amplifying equity sensitivity.
Secondary factors
- Market breadth and leadership from large-cap technology and AI-linked stocks.
- Unexpected corporate news from high-weight S&P 500 constituents.
- Liquidity and execution around the individual Polymarket binaries.
- The remaining calendar: there are 17 regular U.S. trading sessions from September 8 through September 30, assuming the standard weekday calendar.
Weighted Outcome Comparison
I score four still-relevant thresholds on a 1–10 scale. The factors are intentionally analytical rather than tuned to reproduce Polymarket prices.
| Factor | Weight | ↑ $780 | ↓ $760 | ↓ $750 | ↑ $790 | Key Evidence | Impact |
|---|---|---|---|---|---|---|---|
| Distance / path dependence | 30% | 9.0 | 8.8 | 6.6 | 6.8 | ±1.3% for 780/760; ±2.6% for 790/750 from $770.19. | Strongly favors the two nearest thresholds. |
| Recent range & trend | 20% | 8.5 | 6.5 | 5.0 | 7.2 | 52-week high $779.37; Sep 4 range $769.00–$772.87. | Supports $780 more than the deeper tails. |
| CPI / FOMC catalyst | 25% | 6.0 | 8.0 | 7.5 | 5.5 | July CPI 3.4% YoY; August payrolls +162k; Fed meets Sep 15–16. | Current inflation/rate-hike concern skews the catalyst risk downward. |
| Volatility / geopolitical risk | 15% | 7.0 | 8.5 | 8.0 | 6.8 | Oil near $99 and elevated yields add tail sensitivity. | Raises the chance of a quick downside touch. |
| Time remaining | 10% | 8.5 | 8.5 | 8.0 | 8.0 | 17 regular sessions remain from the snapshot. | Enough time for both nearest levels to remain live. |
| Weighted total | 100% | 7.8 | 8.1 | 6.9 | 6.7 | PredictBoy framework | ↓ $760 ranks first, but ↑ $780 is close. |
The framework gives ↓ $760 a small advantage because the distance is minimal and the next major catalysts currently carry more downside rate-risk than upside policy relief. The main uncertainty is that $780 is also extremely close and sits only $0.63 above the current 52-week high.
Topic-Specific Evidence Analysis
Price geometry is more important than a month-end forecast
The last qualifying close of $770.19 makes the nearest two thresholds almost symmetric: $760 is 1.32% below and $780 is 1.27% above. That is why both remain plausible even when the market prefers the downside. The deeper $750 and $790 bands require roughly 2.6% moves, and the probability falls quickly beyond them.
The macro calendar is concentrated in the next eight days
BLS scheduled August PPI for September 10 and August CPI for September 11. The Federal Reserve’s next meeting is September 15–16, with the policy statement and press conference on September 16. The July FOMC held the target range at 3.50%–3.75%, but three voters preferred a 25-basis-point increase. That makes the September inflation prints unusually important for equity discount rates.
Recent data are not an obvious “risk-on” signal
The August employment report showed payrolls up 162,000 and unemployment unchanged at 4.1%. July CPI was 3.4% year over year, while core CPI was 2.5%. Reuters reported that the strong jobs data increased expectations of tighter Fed policy, while rising energy prices and Treasury yields were pressuring equity futures on the morning of September 8.
What the Market May Be Underestimating
The first underappreciated feature is the one-minute touch rule. A threshold can resolve Yes on a brief intraday excursion even if SPY immediately reverses. That makes realized volatility more important than a traditional month-end “target price.”
The second is the premarket exclusion. SPY was indicated at $767.88 before the September 8 open, but that price cannot by itself trigger the $760 or $770 contracts. A qualifying regular-session candle is required.
The third is the apparent ↑ $770 resolution-state mismatch. The event page’s headline number and Yes quote are inconsistent with each other, while daily market data show a September high above $770. Readers should treat the written rules and Pyth data—not a stale-looking headline percentage—as the source of truth.
Bull and Bear Cases for the Major Outcomes
Down $760
Bull case for the contract: hot inflation, a hawkish FOMC repricing, higher oil or yields, or a broad risk-off session produces a 1.3% intraday drop. Bear case: CPI cools, the Fed sounds less hawkish, and the index holds its recent breakout range above the mid-$760s.
Up $780
Bull case for the contract: softer inflation or a dovish rate interpretation pushes SPY through the $779.37 52-week high, making $780 a very small additional step. Bear case: elevated yields cap valuation expansion and the index fails repeatedly near the high.
Down $750
Bull case for the contract: a macro or geopolitical shock creates a 2.6% drawdown from the September 4 close. Bear case: volatility remains contained and buyers defend the upper-$750s/low-$760s.
Up $790
Bull case for the contract: a clean new-high breakout accelerates and broadens. Bear case: $780 is reached but the rally stalls before adding another roughly 1.3%.
Risks and Uncertainties
- Snapshot risk: Polymarket odds and SPY prices can move materially within minutes.
- Spread risk: displayed Buy Yes and Buy No prices can be far apart, so the headline probability may not equal an executable price for a meaningful order.
- Resolution-source risk: Pyth’s exact one-minute candle is decisive; daily quote services are useful context but are not the primary source.
- Event risk: CPI, FOMC communication, geopolitical developments and unexpected corporate news can create gaps or intraday spikes.
- Multiple Yes outcomes: because these are independent threshold contracts, both an upside and a downside level can resolve Yes during the same month.
PredictBoy Probability Assessment
| Contract | PredictBoy probability | Market headline | Interpretation |
|---|---|---|---|
| ↓ $760 | 65% | 68% | Nearest downside level; current macro asymmetry keeps it my base case. |
| ↑ $780 | 50% | 52% | Only a marginal new 52-week high is required. |
| ↓ $750 | 40% | 38% | Needs a larger risk-off move but remains plausible over 17 sessions. |
| ↓ $740 | 27% | 30% | I am slightly below the market on this deeper downside tail. |
| ↑ $790 | 20% | 18% | I give a little more weight to breakout follow-through than the market does. |
| ↑ $800 | 10% | 9% | Requires a roughly 3.9% advance from the last regular close. |
| ↓ $730 | 17% | 16% | Deep downside tail, but the one-minute touch rule keeps it non-zero. |
These probabilities are independent binary assessments and are not intended to total 100%. Several thresholds can be reached in the same month.
Market Odds vs. PredictBoy
My biggest differences are modest. I am slightly less bearish on the immediate $760 touch than Polymarket (65% vs. 68%), slightly less bullish on $780 than the market (50% vs. 52%), and somewhat more willing to assign a breakout continuation to $790 (20% vs. 18%). I am a little below the market on the $740 downside tail (27% vs. 30%).
That is not a strong “the market is wrong” call. The more useful conclusion is that the month is currently centered on a tight $760–$780 decision zone, with macro catalysts capable of pushing SPY through either side.
What Could Change Before Resolution
- September 10 PPI materially changes inflation expectations.
- September 11 CPI surprises relative to the market’s inflation path.
- The September 16 FOMC decision and Summary of Economic Projections reprice the expected policy path.
- SPY breaks above the $779.37 52-week high, turning $780 from resistance into a crossed threshold.
- Oil, Treasury yields or Middle East developments create a rapid risk-off move toward $760 or lower.
- Any Pyth or primary-exchange data issue changes how a borderline touch is verified.
Final Take
PredictBoy analysis, not fact: my current base case is that SPY has a 65% chance of touching $760 during regular trading hours in September, while I give the $780 upside touch a 50% chance. The market is therefore not really about a single month-end direction; it is about whether the next wave of volatility reaches one or both nearby barriers.
If I had to identify the highest-information checkpoints, they are the September 11 CPI release, the September 16 FOMC decision, and the $779.37 52-week high. A clean break above that high makes $780 much easier to reach; a renewed rate or energy shock makes $760 the more immediate path.
Sources
- Polymarket — What will S&P 500 (SPY) hit in September 2026? (market prices, volume, rules; snapshot September 8, 2026, 11:53 UTC (7:53 AM ET / 6:53 PM ICT)).
- Pyth — SPY / US Dollar feed (primary resolution source named by Polymarket).
- MarketWatch — SPY quote (September 4 close/range, 52-week range and September 8 premarket context).
- State Street — SPDR S&P 500 ETF Trust (official fund identity and benchmark context).
- Federal Reserve — July 29, 2026 FOMC statement.
- Federal Reserve — 2026 FOMC calendar.
- BLS — August 2026 Employment Situation.
- BLS — July 2026 CPI.
- BLS — September 2026 release calendar.
- Reuters — Wall Street futures slip as oil surge puts markets on edge, September 8, 2026.
Editorial method: verified facts are sourced above; market-implied signals come from the Polymarket snapshot; weighted scores and PredictBoy touch probabilities are analytical judgments. Prediction-market products can involve financial loss and availability varies by jurisdiction.