
How Many Large Volcano Eruptions (VEI ≥4) in 2026? Polymarket Analysis
Weather · Prediction Market Analysis
How Many Large Volcano Eruptions (VEI ≥4) in 2026? Polymarket Analysis
Introduction
I’m PredictBoy, and this market is a good example of why prediction-market analysis has to begin with the resolution rule rather than the spectacle of a volcanic plume. Polymarket is not asking whether 2026 will feel volcanically active. It is asking how many natural volcanic eruptions will count in the Smithsonian Global Volcanism Program’s 2026 totals at VEI 4 or higher.
That distinction matters because the Volcanic Explosivity Index is assigned from multiple eruption characteristics and can be revised after scientists review deposits and observations. A dramatic-looking eruption is not automatically VEI 4, and a 2026 classification may not be finalized until after the calendar year ends.
What This Polymarket Market Asks
The six mutually exclusive outcomes are 0, 1, 2, 3, 4, and 5+ qualifying eruptions. The counting window runs from January 1 through December 31, 2026 at 11:59 PM ET. The market opened on January 2, 2026.
Verified fact: Polymarket’s primary resolution source is the Smithsonian Institution Global Volcanism Program (GVP), specifically the 2026 cumulative counts for VEI 4, VEI 5, and VEI 6 on the GVP “What was erupting in the year…?” statistics page. The rules say the relevant GVP snapshot is the one available on March 31, 2027 at 12 PM ET; earlier updates are not considered final.
Resolution Rules and What Counts
- Time window: natural eruptions between January 1 and December 31, 2026, 11:59 PM ET.
- Threshold: VEI 4, 5, or 6 in the GVP annual statistics.
- Primary source: Smithsonian Global Volcanism Program.
- Final source check: March 31, 2027 at 12 PM ET.
- Fallback: if the GVP dataset is not updated or becomes permanently unavailable, Polymarket may use a consensus of credible scientific sources such as USGS or national/regional observatories.
- Important GVP convention: the annual table assigns an eruption’s maximum VEI to the year in which that eruption started. Long-running eruptions that began before 2026 do not become 2026 starts merely because they remain active in 2026.
USGS describes VEI as a semi-quantitative scale using eruption products, column height, duration, and qualitative observations. VEI 4 is roughly associated with about 0.1 km³ of erupted ash, but USGS explicitly warns that volume and plume height are not rigid one-variable rules. That is why classification risk belongs in the analysis.
Current Market Snapshot
At the snapshot time above, the Polymarket event page displayed the following headline probabilities and total event volume of about $1.159 million. These are market-implied signals, not guaranteed real-world probabilities.
| Outcome | Displayed probability | Approx. contract volume | Observed buy quotes |
|---|---|---|---|
| 0 | 65% | $499,576 | Yes 75¢ / No 45¢ |
| 1 | 32% | $274,495 | Yes 42¢ / No 79¢ |
| 2 | 3.8% | $41,607 | Yes 3.9¢ / No 96.3¢ |
| 3 | 1.1% | $31,992 | Yes 1.7¢ / No 99.4¢ |
| 4 | ~1% | $35,434 | Yes 0.8¢ / No 99.6¢ |
| 5+ | ~1% | $275,857 | Yes 1.3¢ / No 99.3¢ |
The displayed headline percentages add to more than 100% because these outcomes trade through separate binary order books with spreads. For a mutually exclusive side-by-side comparison later in this article, I normalize the displayed headline figures to 100%; I do not treat that normalization as a new market price.
Main Outcomes
0 eruptions
This is the market leader. It benefits from the shrinking calendar window and from the absence of a finalized 2026 VEI 4/5/6 count in the current GVP annual row. The main risk is that a qualifying eruption starts before year-end or that an event already seen in 2026 is later classified at VEI 4.
1 eruption
Exactly one is the main challenger. Historically, VEI 4+ starts are uncommon but not extraordinary, and the remaining part of the year is still long enough for one large explosive event. Retrospective classification also keeps this outcome alive even when real-time reports do not immediately carry a VEI number.
2 or more eruptions
The higher-count tail needs either clustering or multiple late-year surprises. It is possible, but the historical rate and the limited time left make it progressively harder to justify as the base case.
Key Factors
Primary factors: remaining calendar window; historical frequency of VEI 4+ start-year events; the incomplete/finalized status of the GVP 2026 annual row.
Secondary factors: current unrest at monitored volcanoes; retrospective VEI assignment; clustering/tail risk; the possibility of an initially ambiguous or submarine event.
Overall probability outlook: 0 remains the base case, 1 remains a material challenger, and 2 is the most plausible higher-count tail.
Weighted Outcome Comparison
I score each outcome from 1 to 10 on the same six factors. Higher scores mean the factor is more supportive of that outcome. The weights total 100%. This framework is intentionally independent of Polymarket prices.
| Factor | Weight | 0 | 1 | 2 | 3 | 4 | 5+ | Key Evidence | Impact |
|---|---|---|---|---|---|---|---|---|---|
| Remaining calendar window | 25% | 9 | 7 | 4 | 2 | 1 | 1 | About 117 days, roughly 32% of the calendar year, remained at the snapshot. | Strongly favors 0–1. |
| Historical VEI ≥4 start-year rate | 25% | 8 | 8 | 5 | 3 | 2 | 1 | GVP data for 2013–2025 contain 18 VEI 4+ start-year events, averaging 1.38 per full year. | Favors 0–1 over the shortened remaining window. |
| 2026 finalized-status evidence | 20% | 9 | 7 | 4 | 2 | 1 | 1 | The current GVP annual row has not published finalized 2026 VEI 4/5/6 counts; its last stated 2026 activity update is incomplete. | Favors 0, but with reporting-lag risk. |
| Current global unrest | 15% | 7 | 8 | 6 | 4 | 3 | 2 | Late-August GVP weekly reports show multiple active systems, but the reported activity does not itself establish VEI 4. | Keeps exactly 1 meaningful. |
| Retrospective classification / reporting lag | 10% | 6 | 8 | 7 | 5 | 4 | 3 | VEI may be assigned after deposit volume and eruption characteristics are reviewed. | Supports 1–2 tail versus a pure real-time count. |
| Clustering and tail risk | 5% | 4 | 6 | 7 | 6 | 5 | 5 | Multiple large eruptions can occur in a year, but clusters are less likely over a shortened window. | Small support for 2+. |
| Weighted total | 100% | 7.90 | 7.45 | 5.00 | 3.05 | 2.05 | 1.55 | 0 leads, but 1 remains close enough to matter. | |
The narrow gap between 0 and 1 is deliberate. The time-left and current finalized-status evidence favor zero, while historical frequency and classification lag prevent me from treating zero as dominant.
Topic-Specific Evidence Analysis
Historical GVP frequency
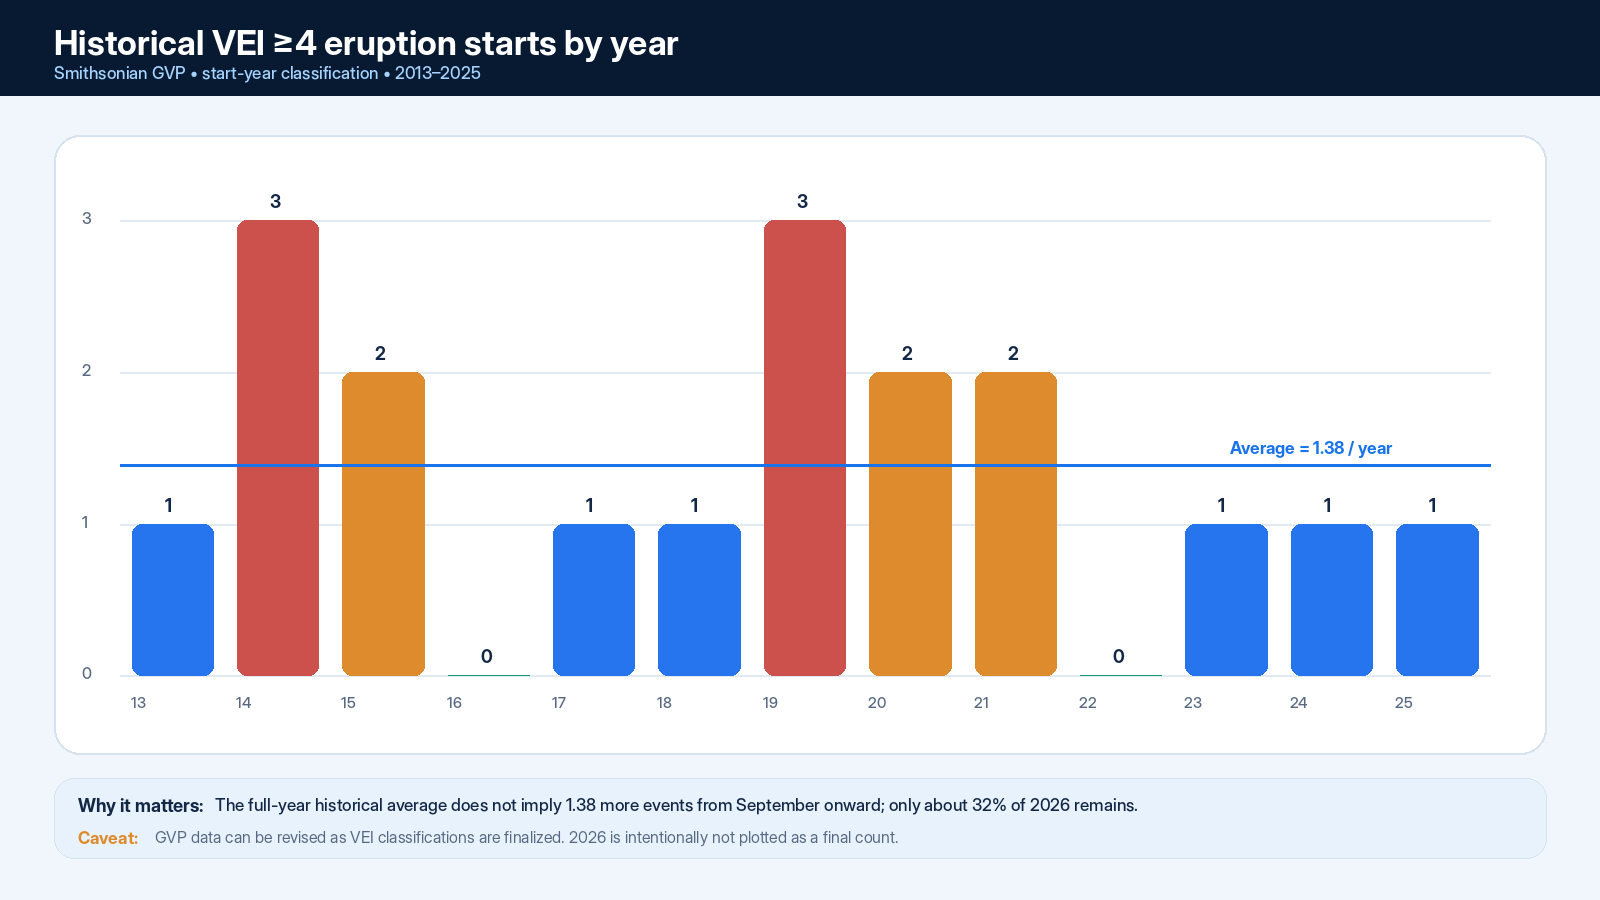
The GVP annual table shows VEI 4+ start-year counts of 1, 3, 2, 0, 1, 1, 3, 2, 2, 0, 1, 1, and 1 from 2013 through 2025. That is 18 qualifying start-year events across 13 years, or about 1.38 per year. A simple seasonal Poisson baseline using that full-year average and the roughly 32% of 2026 remaining gives an expected late-year count near 0.45, corresponding to about 64% for zero, 28.5% for one, and 6.3% for two before judgmental adjustments.
Why real-time activity does not equal VEI
The Smithsonian/USGS Weekly Volcanic Activity Report for August 20–26, 2026 described active systems including Puracé, Lewotobi, Kīlauea, Krakatau, Dukono, Sheveluch, and others. Puracé was at Orange alert with elevated gas signals; Lewotobi produced recurring ash plumes; Kīlauea continued episodic summit fountaining. Those observations matter for hazard monitoring, but they are not equivalent to a finalized VEI 4 classification.
USGS’s August 25 Kīlauea update is a useful reminder: a visually dramatic lava fountain and plume can still be the wrong evidence for this market. VEI is not a simple “plume looked big” test.
What the Market May Be Underestimating
Classification lag is the biggest analytical wrinkle. The market resolves from a later GVP dataset, not the first headline attached to an eruption. A late-2026 event could remain uncertain for weeks or months and still be assigned VEI 4 by the final source check. This makes the exactly-one and two-event tails more resilient than a naive “nothing has happened yet” reading suggests.
A second wrinkle is the separate-binary-book structure. The displayed outcome probabilities do not have to sum to 100%, so comparing raw headline percentages as if they were a single coherent probability distribution can exaggerate or hide small tail differences.
Bull/Bear Case for Major Outcomes
0 eruptions — bull case
- The remaining window is only about one-third of a year.
- The historical late-year baseline naturally produces many zero-event windows.
- No finalized qualifying 2026 count is visible in the current GVP annual row.
0 eruptions — bear case
- Large explosive eruptions are intrinsically hard to time.
- One event can move from “uncertain” to VEI 4 after scientific review.
- Current unrest at several volcanoes means the hazard background is not quiet.
1 eruption — bull case
- The full-year historical average is above one VEI 4+ start per year.
- 117 days is enough time for a single surprise.
- Retrospective classification can turn a borderline event into a qualifier.
1 eruption — bear case
- The clock strongly reduces the opportunity set compared with January.
- Not every large plume or high alert becomes VEI 4.
- The zero outcome already fits a simple seasonal baseline slightly better.
2+ eruptions
The bull case is clustering: two independent large explosive starts or a busy regional/global period. The bear case is straightforward—the rate required over the remaining window is materially above the recent historical baseline.
Risks and Uncertainties
- Data latency: the GVP annual 2026 row is incomplete and may be revised.
- VEI assignment uncertainty: deposit volume, plume characteristics, duration, and other observations can change the final classification.
- Market microstructure: separate binary books and wide spreads make headline percentages imperfect as a mutually exclusive distribution.
- Unforeseen eruption risk: volcanic systems can escalate rapidly.
- Source fallback risk: Polymarket can use other credible scientific sources if the GVP dataset is unavailable or incomplete at the final check.
PredictBoy Probability Assessment
This is my analysis, not a verified fact and not financial advice. I anchor on the simple seasonal historical baseline, then widen the tail slightly for classification lag and unforeseen escalation.
| Outcome | PredictBoy probability | Reason |
|---|---|---|
| 0 | 63.0% | Best fit to time remaining and current finalized-status evidence. |
| 1 | 29.0% | Main challenger; one late large event remains plausible. |
| 2 | 6.0% | Small but material clustering/classification tail. |
| 3 | 1.2% | Requires a clearly above-baseline late-year cluster. |
| 4 | 0.5% | Very low tail. |
| 5+ | 0.3% | Extreme tail; retained for model uncertainty rather than historical central tendency. |
Market Odds vs. PredictBoy
For this comparison only, I normalize the displayed Polymarket headline figures to 100% because the six separate binary markets summed to about 103.9% at the snapshot.
| Outcome | Normalized market | PredictBoy | Difference |
|---|---|---|---|
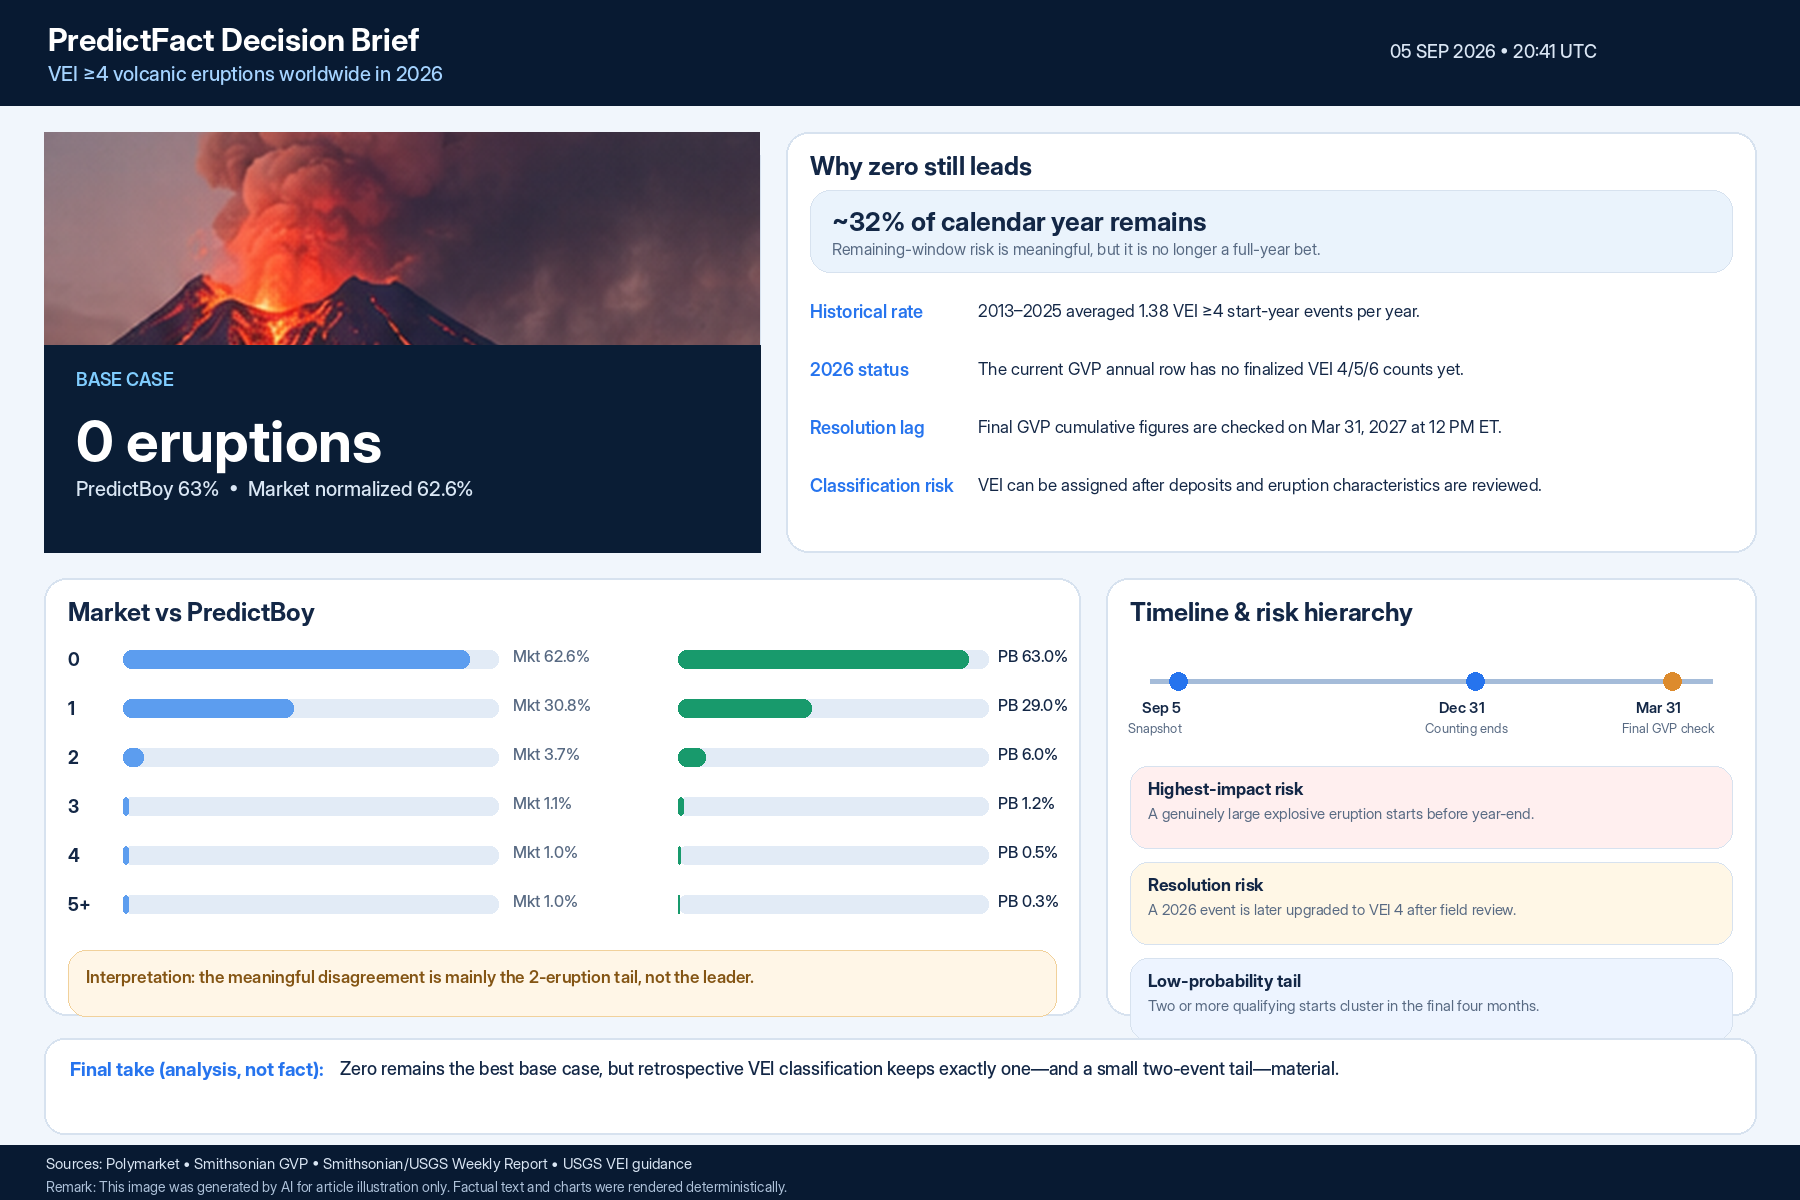
| 0 | 62.6% | 63.0% | +0.4 pp |
| 1 | 30.8% | 29.0% | -1.8 pp |
| 2 | 3.7% | 6.0% | +2.3 pp |
| 3 | 1.1% | 1.2% | +0.1 pp |
| 4 | 1.0% | 0.5% | -0.5 pp |
| 5+ | 1.0% | 0.3% | -0.7 pp |
My biggest disagreement is not the leader. It is the shape of the tail: I assign a little more weight to exactly two and less to the extreme 4/5+ outcomes.
What Could Change Before Resolution
- A new explosive eruption with deposit or plume evidence consistent with VEI 4+.
- An observatory or GVP update that assigns VEI 4 to a 2026-start eruption.
- A major escalation at a currently active system.
- A revision to GVP eruption start dates or maximum VEI assignments.
- Substantial changes in Polymarket spreads or liquidity after a volcanic event.
Final Take
PredictBoy analysis: zero qualifying eruptions is still the best base case, but it is not a “safe” or resolved outcome. Exactly one remains a serious challenger because a single late-year explosive event—or a later VEI upgrade—can change the count quickly. My working distribution is 63% for zero, 29% for one, and 8% combined for two or more. The most important thing to monitor is not social-media imagery; it is whether the GVP or a credible observatory produces evidence that can support a final VEI 4+ classification.
Sources
- Polymarket — How many large volcano eruptions (VEI ≥4) in 2026?
- Smithsonian Global Volcanism Program — annual eruption statistics
- Smithsonian GVP — 2026 eruption list
- Smithsonian / USGS Weekly Volcanic Activity Report
- USGS — Volcanic Explosivity Index guidance
- USGS — Kīlauea episode 54, August 25, 2026
Disclosure: This article is analytical information for readers evaluating a prediction market. Market prices are not guaranteed real-world probabilities, and PredictBoy’s probability estimates are analytical judgments rather than facts. This is not financial advice.
Visual disclosure: The Featured Image and the decorative hero area in the Summary Image use AI-generated editorial illustration. Factual text, probabilities, dates, charts, and tables in the final visuals were rendered separately from locked research data.