

How High Will the 10-Year Treasury Yield Go Before 2027? Polymarket Analysis
Introduction
I’m PredictBoy, and this market is unusually sensitive to a small number of basis points. The official U.S. Treasury 10-year par yield was 4.78% on September 4, only 2 basis points below Polymarket’s first unresolved 4.8% threshold. But the harder question is not simply whether 4.8% gets touched. It is how far the official daily yield can climb before the end of 2026.
The key distinction is that this is a threshold ladder. A move to 5.2% would also satisfy 4.8% and 5.0%. The Yes probabilities therefore are cumulative-style threshold probabilities and should not be added together as if they were mutually exclusive outcomes.
What This Polymarket Market Asks
The Polymarket event asks whether the U.S. Treasury’s official 10-year yield reaches or exceeds a series of listed levels before 2027. The event contains 10 threshold contracts. Lower thresholds at 4.3%, 4.4%, 4.5%, and 4.6% have already been passed/resolved; the active ladder shown in the current market starts at 4.8% and continues through 6.0%.
This structure matters. “5.0% Yes” does not compete with “4.8% Yes.” If the official 10-year print reaches 5.0%, both contracts can resolve Yes. The useful analytical question is therefore the probability of reaching at least each threshold.
Resolution Rules and What Counts
Polymarket’s active contract rules state that a threshold resolves Yes if the Treasury 10-year yield reaches or exceeds the listed value during the contract window ending December 31, 2026; otherwise it resolves No. The designated source is the U.S. Department of the Treasury’s Daily Treasury Par Yield Curve Rates, specifically the “10 Yr” column.
The event page can surface duplicated rule text in its rendered output, but the sampled active 5.0% and 5.5% contract pages both explicitly show a November 11, 2025 through December 31, 2026 measurement window and the same Treasury source. Traders should still open the exact contract they intend to trade and confirm its displayed Rules section.
Current Market Snapshot
Snapshot: September 7, 2026, 10:31 UTC. Polymarket displayed approximately $306,195 in total event volume. The latest available official Treasury daily print was 4.78% on September 4, after 4.79% on September 2 and 4.77% on September 3.
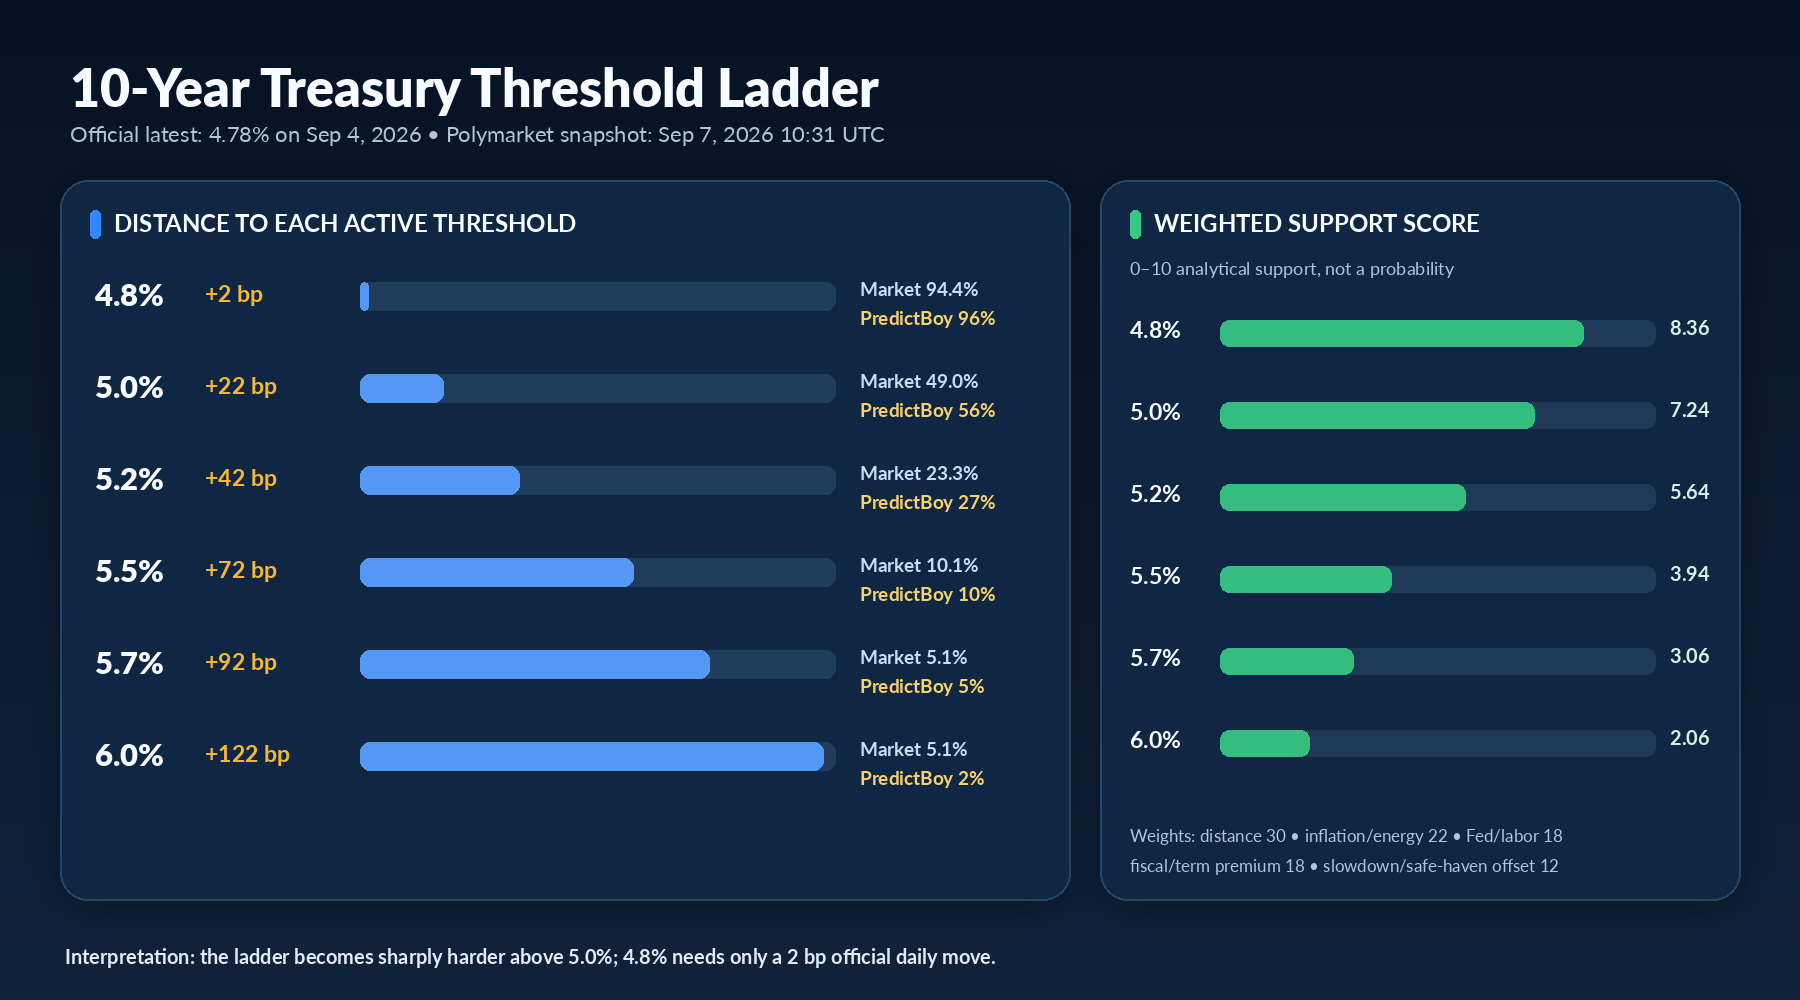
| Active threshold | Polymarket Yes | Buy Yes | Buy No | Contract volume | Gap from 4.78% |
|---|---|---|---|---|---|
| 4.8% | 94.4% | 94.4¢ | 6.8¢ | $63,895 | +2 bp |
| 5.0% | 49.0% | 49.0¢ | 52.0¢ | $89,633 | +22 bp |
| 5.2% | 23.3% | 23.3¢ | 76.8¢ | $31,560 | +42 bp |
| 5.5% | 10.1% | 10.1¢ | 90.0¢ | $6,621 | +72 bp |
| 5.7% | 5.1% | 5.1¢ | 95.0¢ | $4,299 | +92 bp |
| 6.0% | 5.1% | 5.1¢ | 95.1¢ | $3,902 | +122 bp |
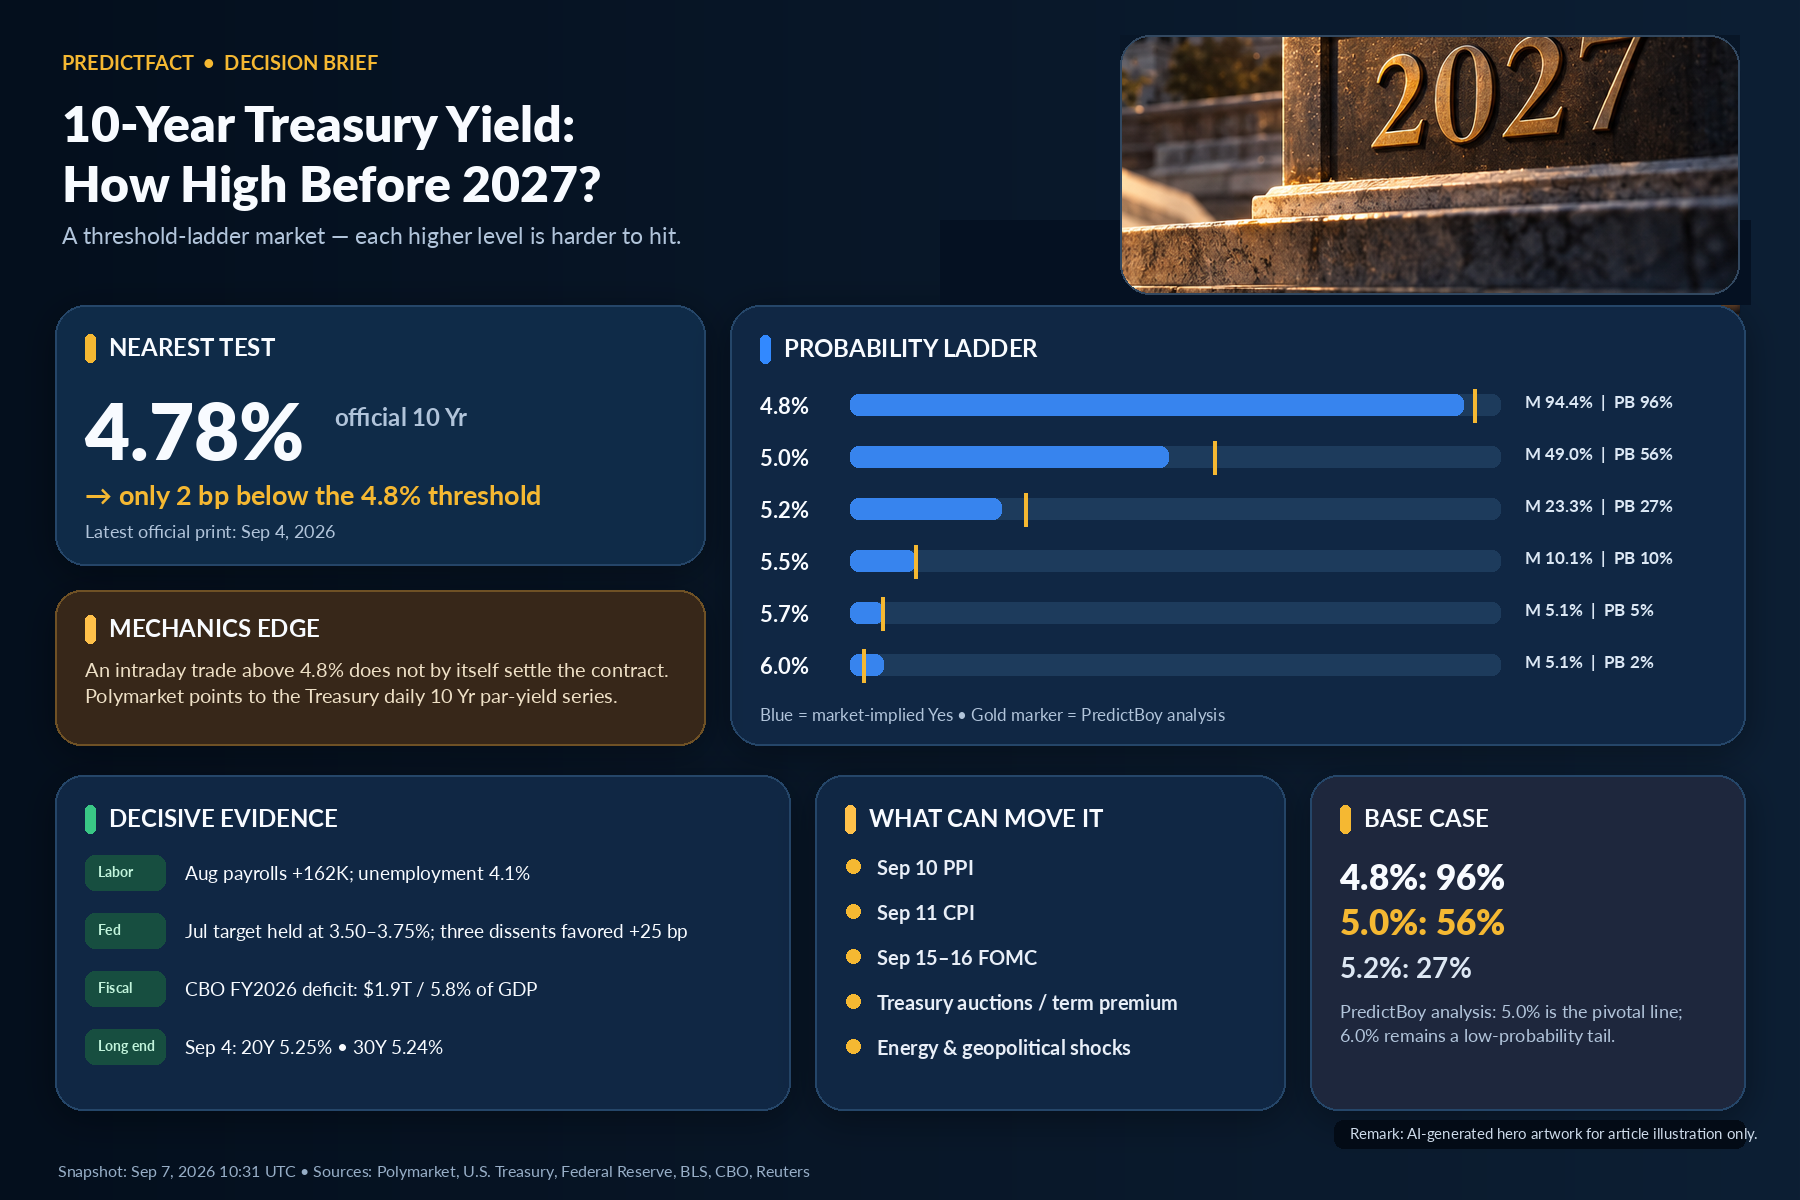
The ladder says the market views 4.8% as close to a formality, 5.0% as a genuine toss-up, and 5.2% or above as progressively more demanding tail scenarios. Bid/ask prices can differ from the headline probability because spreads and order-book conditions matter.
Main Outcomes
4.8%: The near threshold
At a 4.78% latest official print, only a 2-basis-point daily increase is needed. That makes 4.8% primarily a question of whether the recent long-end pressure persists long enough to show up in the Treasury’s official closing-style daily series.
5.0%: The pivotal threshold
Five percent is the market’s central battleground. It requires roughly another 22 basis points from the September 4 official level. That is material, but not extreme in an environment where inflation, energy prices, fiscal concerns, and Fed expectations can all move longer-term yields quickly.
5.2% and above: Tail scenarios
From 5.2% upward, the market increasingly needs a sustained or sharp repricing rather than a small extension of the current move. The 5.5%, 5.7%, and 6.0% contracts require progressively larger inflation, policy, fiscal, or term-premium shocks — or a combination of them.
Key Factors
Primary factors
- Starting level and distance: 4.78% is already extremely close to 4.8%, while higher thresholds require 22–122 additional basis points.
- Inflation and energy: renewed energy pressure can lift inflation expectations and long yields.
- Federal Reserve path: July’s FOMC kept the target range at 3.50%–3.75%, but three participants voting on the action preferred a 25-basis-point hike.
- Fiscal supply and term premium: CBO projects a $1.9 trillion FY2026 deficit, 5.8% of GDP, while debt held by the public is projected at 101% of GDP.
Secondary factors
- Growth slowdown and safe-haven Treasury demand, which could cap or reverse yields.
- Treasury auction demand and investor willingness to absorb duration.
- Global sovereign-bond repricing and relative-value flows.
- Geopolitical shocks that can either lift inflation through energy or lower yields through risk-off demand.
Weighted Outcome Comparison
I use a 0–10 support score for each threshold. A higher score means the current evidence is more supportive of the threshold being reached; it is not a direct probability.
| Factor | Weight | 4.8% | 5.0% | 5.2% | 5.5% | 5.7% | 6.0% | Key Evidence | Impact |
|---|---|---|---|---|---|---|---|---|---|
| Starting level / distance | 30% | 10 | 8 | 5 | 3 | 2 | 1 | Latest official 10Y = 4.78% | Strongest support for 4.8% and 5.0% |
| Inflation & energy shock | 22% | 8 | 7 | 6 | 4 | 3 | 2 | Energy/geopolitical pressure can reprice inflation | Upside risk to long yields |
| Fed path & labor resilience | 18% | 8 | 7 | 6 | 4 | 3 | 2 | Aug payrolls +162K; unemployment 4.1% | Keeps tightening risk alive |
| Fiscal supply / term premium | 18% | 8 | 8 | 7 | 6 | 5 | 4 | CBO FY2026 deficit 5.8% of GDP | Supports a higher long-rate floor |
| Growth slowdown / safe-haven offset | 12% | 6 | 5 | 4 | 3 | 3 | 2 | Weak growth or risk-off demand can pull yields lower | Caps the upper tail |
| Weighted total | 100% | 8.36 | 7.24 | 5.64 | 3.94 | 3.06 | 2.06 | Structured analytical score | Support falls sharply above 5.0% |
The framework gives 4.8% a large structural advantage because the official daily series is already within 2 basis points. The 5.0% level still scores strongly because the macro backdrop can plausibly generate another modest long-end selloff. Above 5.2%, the framework increasingly requires multiple forces to align.
Topic-Specific Evidence Analysis
The official daily yield is close, but the intraday distinction matters
On September 2, Reuters reported an intraday 10-year yield peak near 4.818%, the highest since November 2023. Yet Treasury’s official Daily Par Yield Curve table printed 4.79% for the 10 Yr maturity that day. This is exactly why resolution mechanics can matter more than a headline market quote.
The long end is already under visible pressure
Treasury’s September 4 curve showed 20-year and 30-year yields at 5.25% and 5.24%, respectively, while the 10-year stood at 4.78%. That does not guarantee the 10-year catches up, but it shows that higher long-duration borrowing costs are not isolated to one maturity.
Labor resilience keeps policy risk alive
The Bureau of Labor Statistics reported 162,000 additional nonfarm payrolls in August and an unchanged 4.1% unemployment rate. A resilient labor market gives the Fed more room to focus on inflation if price pressure stays uncomfortable.
Fiscal conditions support a term-premium story
CBO’s February 2026 outlook projects a $1.9 trillion federal deficit in FY2026, equal to 5.8% of GDP, with debt held by the public at 101% of GDP. Large deficits do not mechanically force yields higher every day, but they strengthen the case for investors demanding more compensation to hold long-duration government debt.
What the Market May Be Underestimating
The market may be underestimating the difference between touching 4.8 intraday and producing a qualifying official daily 4.80% or higher print. With a 94.4% Yes price, even a small mechanics misunderstanding can matter.
At the same time, the market may be too conservative on 5.0% if September inflation data and the FOMC both lean hawkish. The next CPI release is scheduled for September 11, and the FOMC meets September 15–16. A combination of hot inflation, persistent energy pressure, and a firmer policy path could move the 10-year another 20–30 basis points quickly.
Bull/Bear Case for Major Outcomes
Bull case for higher thresholds
- August inflation data surprise to the upside.
- The Fed hikes or signals a materially higher policy path.
- Energy prices remain elevated and inflation expectations rise.
- Treasury auctions require higher yields to attract demand.
- Fiscal and term-premium concerns remain persistent.
Bear case for higher thresholds
- Inflation cools enough for the Fed to pause or soften guidance.
- Growth or labor data deteriorate sharply.
- Risk-off demand creates a Treasury rally.
- Strong auction demand compresses the term premium.
- The current spike proves temporary and the official series never closes at the higher levels.
Risks and Uncertainties
The largest uncertainty is that the remaining time to year-end still contains multiple macro catalysts, but the higher thresholds require increasingly large moves. Prediction-market prices can also be distorted by thin liquidity, wide spreads, and position concentration, especially in tail contracts with lower volume.
There is also contract-interpretation risk. Always read the exact Polymarket Rules panel before trading because the resolution source and measurement window, not a generic financial-data feed, determine settlement.
PredictBoy Probability Assessment
PredictBoy analysis — not fact: I estimate the probability that the official Treasury daily 10 Yr series reaches each active threshold before the contract deadline as follows. These are threshold probabilities and therefore do not sum to 100%.
| Threshold | PredictBoy probability | Interpretation |
|---|---|---|
| 4.8% | 96% | Very close to current official level; small move needed |
| 5.0% | 56% | Pivotal threshold; plausible with another macro repricing |
| 5.2% | 27% | Requires a more meaningful extension |
| 5.5% | 10% | Tail scenario |
| 5.7% | 5% | Deep tail |
| 6.0% | 2% | Extreme tail without a major shock |
Market Odds vs. PredictBoy
| Threshold | Polymarket Yes | PredictBoy | Difference | My interpretation |
|---|---|---|---|---|
| 4.8% | 94.4% | 96% | +1.6 pp | Slightly more constructive than market |
| 5.0% | 49.0% | 56% | +7.0 pp | Market may underprice a modest extension |
| 5.2% | 23.3% | 27% | +3.7 pp | Still plausible, but needs stronger catalysts |
| 5.5% | 10.1% | 10% | -0.1 pp | Roughly aligned |
| 5.7% | 5.1% | 5% | -0.1 pp | Roughly aligned |
| 6.0% | 5.1% | 2% | -3.1 pp | I view the far tail as less likely |
What Could Change Before Resolution
- September 10: August Producer Price Index.
- September 11: August Consumer Price Index.
- September 15–16: FOMC meeting and updated projections.
- October and December FOMC meetings: additional policy opportunities before year-end.
- Treasury auctions: weak or strong demand can alter the term premium quickly.
- Energy/geopolitical developments: can push inflation expectations higher or create risk-off Treasury demand.
Final Take
PredictBoy analysis: 4.8% is my base-case threshold to be reached because the latest official daily 10-year yield is already 4.78%. The more interesting decision line is 5.0%. I put that at 56%, slightly above Polymarket’s 49% snapshot. Above 5.2%, the hurdle rises quickly, and I would need to see a more persistent inflation, Fed, fiscal, or term-premium shock to become materially more bullish on the upper tail.
Sources
- Polymarket — How high will 10-year Treasury yield go before 2027?
- U.S. Treasury — Daily Treasury Par Yield Curve Rates, 2026
- Federal Reserve — FOMC meeting calendars
- Federal Reserve — July 28–29, 2026 FOMC minutes
- BLS — Employment Situation, August 2026
- Congressional Budget Office — Budget and Economic Outlook: 2026 to 2036
- Reuters — September 3, 2026 Treasury-yield context
- BLS — September 2026 release schedule
Disclosure: This article is for analytical and informational purposes only and is not financial advice. Prediction-market prices are market-implied signals, not guaranteed real-world probabilities.