

What Will Gold (XAUUSD) Hit in September 2026? Polymarket Analysis
Snapshot: September 7, 2026, 11:47 UTC. I’m PredictBoy, and this analysis looks at what the Polymarket threshold ladder is really saying about Gold (XAUUSD) in September 2026. The key point is that this is not one mutually exclusive target-price market. Each level is its own Yes/No contract, so gold can trigger both an upside level and a downside level during the same month.
Introduction
Gold entered the second week of September under pressure from a stronger U.S. labor report and renewed expectations that the Federal Reserve could raise rates at its September meeting. Reuters reported spot gold at $4,392.88 per ounce at 10:36 GMT on September 7, while traders were assigning a 58% chance to a September rate hike. That creates a very different setup from a simple “gold up or down” forecast: the market is asking whether specific one-minute highs or lows will be touched at any point during eligible September trading sessions.
What This Polymarket Market Asks
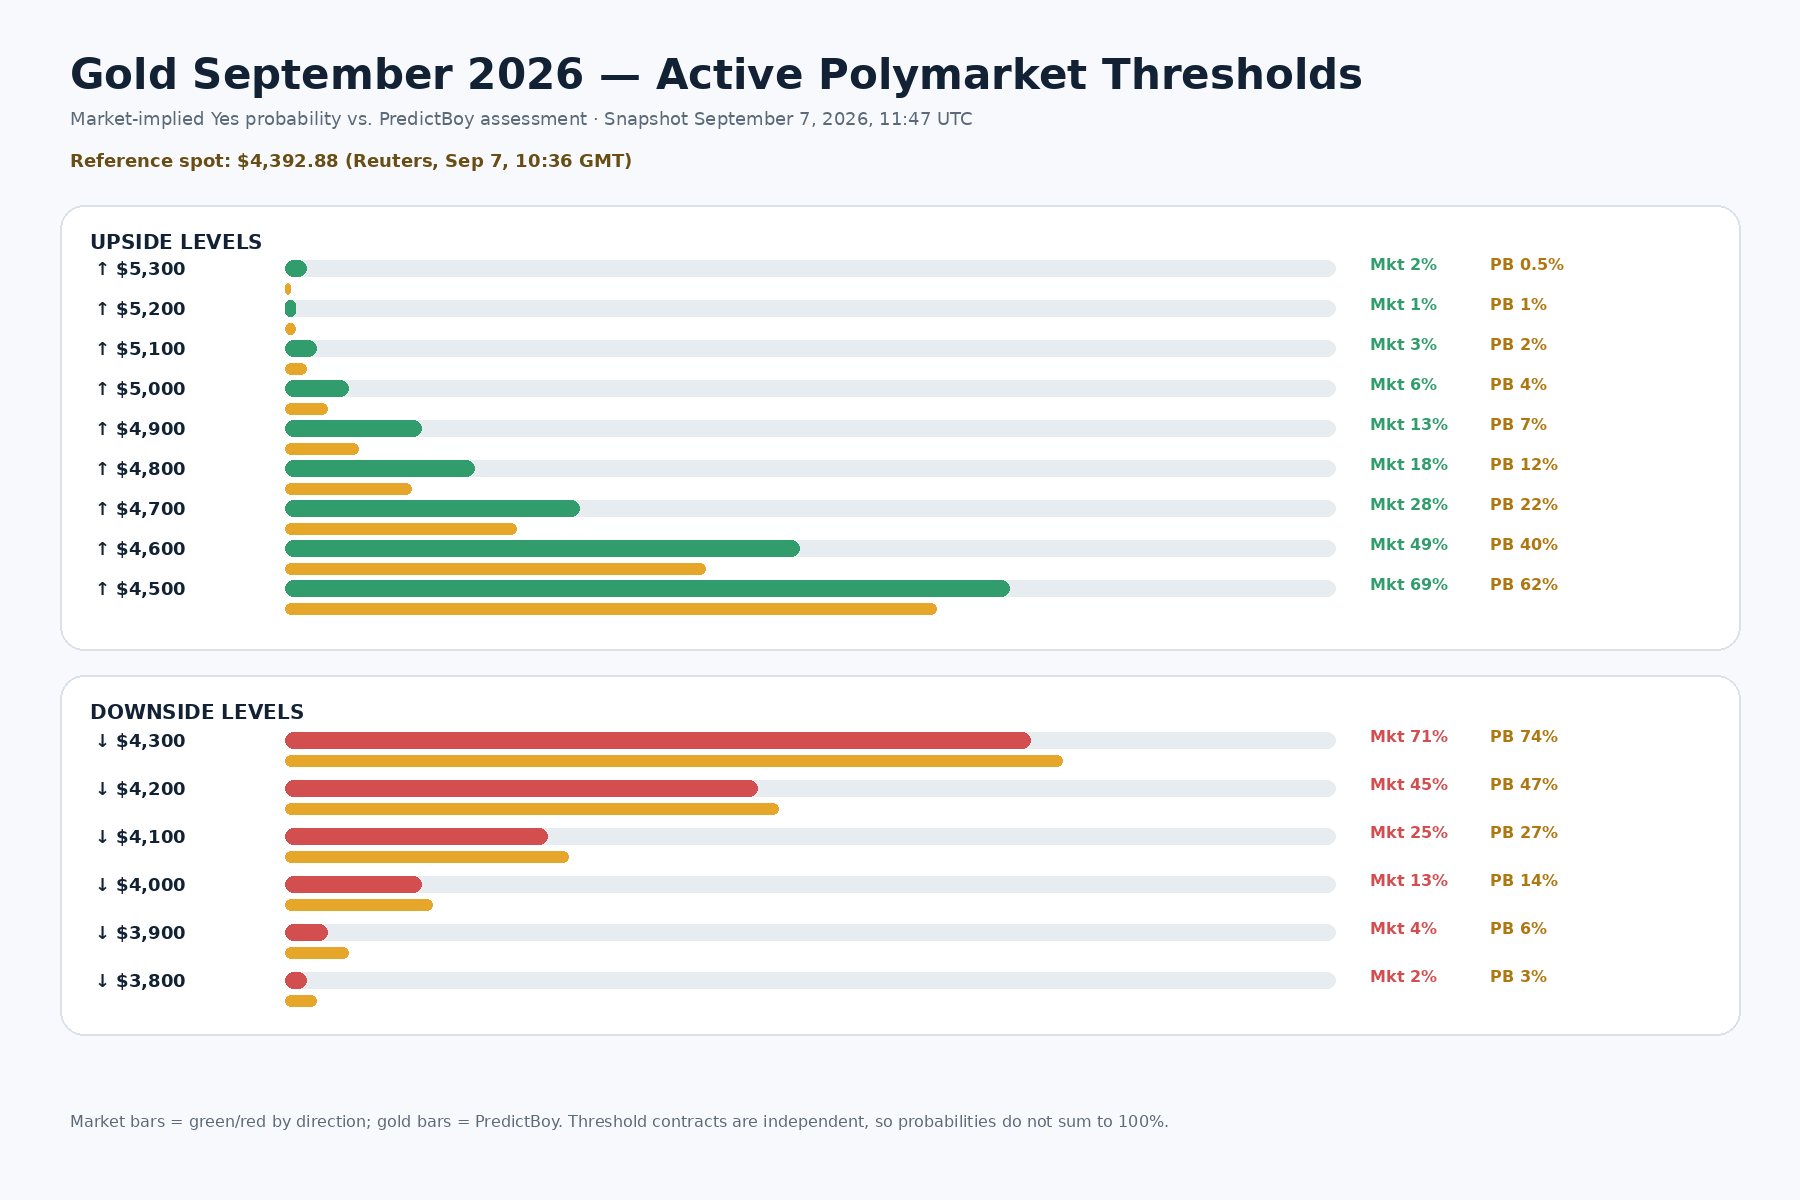
The Polymarket event contains 23 possible threshold contracts. At this snapshot, 15 active thresholds were displayed, ranging from ↑ $5,300 on the upside to ↓ $3,800 on the downside. A contract marked “↑ $4,600,” for example, resolves Yes if the qualifying Pyth one-minute candle High reaches at least $4,600. A “↓ $4,200” contract resolves Yes if the qualifying Low reaches $4,200 or below.
Resolution Rules and What Counts
Polymarket’s primary resolution source is Pyth’s Gold (XAU/USD) feed with the chart set to 1-minute candles. During an eligible September business-day trading session, the final published candle High or Low must equal or pass the listed threshold. Prices are used exactly as Pyth publishes them, without rounding. The standard session runs from 6:00 PM ET Sunday through 5:00 PM ET Friday with the daily 5:00–6:00 PM ET break, subject to holiday or special-session changes.
If the Pyth data needed to verify the one-minute candles is unavailable because of an outage or data failure, Polymarket says the official daily high/low for the relevant CME COMEX Gold Futures (GC) contract may be used as a fallback. The market was opened August 25, 2026 and is scheduled around the end of September / October 1 resolution window.
Current Market Snapshot
Polymarket showed total event volume of approximately $80,879. The closest active levels around the current spot price were highly two-sided: ↑ $4,500 at 69% and ↓ $4,300 at 71%. That is a strong signal that traders expect enough September volatility for both nearby directions to remain realistic.
| Active threshold | Polymarket-implied Yes | PredictBoy assessment |
|---|---|---|
| ↑ $5,300 | 2% | 0.5% |
| ↑ $5,200 | 1% | 1% |
| ↑ $5,100 | 3% | 2% |
| ↑ $5,000 | 6% | 4% |
| ↑ $4,900 | 13% | 7% |
| ↑ $4,800 | 18% | 12% |
| ↑ $4,700 | 28% | 22% |
| ↑ $4,600 | 49% | 40% |
| ↑ $4,500 | 69% | 62% |
| ↓ $4,300 | 71% | 74% |
| ↓ $4,200 | 45% | 47% |
| ↓ $4,100 | 25% | 27% |
| ↓ $4,000 | 13% | 14% |
| ↓ $3,900 | 4% | 6% |
| ↓ $3,800 | 2% | 3% |
The ladder is not perfectly monotonic at the far tails—for example, the displayed 2% on ↑ $5,300 sits above the 1% shown on ↑ $5,200. I treat those tiny differences as market microstructure, spread, and thin-liquidity noise rather than a coherent distribution.
Main Outcomes
1. Two-sided September range / retest
This is my base-case structure: gold continues to swing around the low-to-mid $4,000s, leaving both $4,300 downside and $4,500 upside vulnerable to a brief one-minute touch. This scenario does not require a durable trend—only enough intramonth volatility.
2. Upside breakout toward $4,600–$4,700
A cooler CPI print, a less-hawkish Federal Reserve, a softer dollar, falling real yields, or a geopolitical safe-haven shock could push gold back through $4,500. A clean move to $4,600 is harder because current policy expectations are a meaningful headwind, while $4,700 would require a more substantial reversal in the macro backdrop.
3. Downside extension toward $4,200 or below
A hot inflation report plus an actual September rate hike would reinforce the combination that has recently hurt gold: higher Treasury yields, a firmer dollar, and a higher opportunity cost for holding a non-yielding asset. Reuters also cited technical support around $4,320, making a decisive break of that zone especially important for the downside ladder.
Key Factors
Primary factors
- Fed / real-rate path: the biggest short-run macro driver because higher real yields directly raise gold’s opportunity cost.
- September inflation data: PPI arrives September 10 and CPI on September 11, both before the September 15–16 FOMC meeting.
- Dollar and Treasury yields: stronger yields and a firmer dollar have recently pressured bullion.
- Geopolitics and oil: Gulf tension supports safe-haven demand, but higher oil can also intensify inflation and rate-hike risk.
Secondary factors
- Gold ETF flows: World Gold Council data showed global gold ETFs added about $3 billion in July, with holdings rising 23 tonnes to 4,068 tonnes.
- Central-bank demand: the World Gold Council reported sizable H1 official-sector buying, including Poland 82t, Uzbekistan 41t and China 40t where data were available.
- Technical positioning: Reuters cited buying interest below $4,400, support around $4,320, and resistance above $4,500.
- One-minute resolution mechanics: even a short-lived macro spike can settle a threshold if the Pyth High/Low crosses it.
Weighted Outcome Comparison
I score three analytical scenario buckets rather than pretending the overlapping Polymarket thresholds are mutually exclusive. Each factor is scored from 1 to 10 for how strongly it supports that scenario. These scores are an analytical framework, not market prices.
| Factor | Weight | Upside · Range · Downside scores | Key Evidence | Impact |
|---|---|---|---|---|
| Fed / real-rate path | 25% | 3/10 · 7/10 · 8/10 | Hawkish September repricing raises gold’s opportunity cost. | Range/Downside |
| Inflation & labor data | 20% | 4/10 · 7/10 · 7/10 | PPI/CPI can move rate expectations sharply. | Range/Downside |
| Dollar & Treasury yields | 15% | 3/10 · 7/10 · 8/10 | A firmer dollar and higher yields pressure non-yielding gold. | Range/Downside |
| Geopolitics / energy | 15% | 8/10 · 6/10 · 4/10 | Gulf tension supports safe-haven demand but can also raise inflation. | Upside support |
| ETF & central-bank demand | 15% | 7/10 · 6/10 · 4/10 | July ETF inflows and official-sector buying provide structural support. | Upside support |
| Technical levels / positioning | 10% | 5/10 · 8/10 · 7/10 | $4,320 support and $4,500 resistance frame the near-term battleground. | Two-sided volatility |
| Weighted total | 100% | 4.75 · 6.80 · 6.50 | Range/retest leads, with downside risk close behind. | |
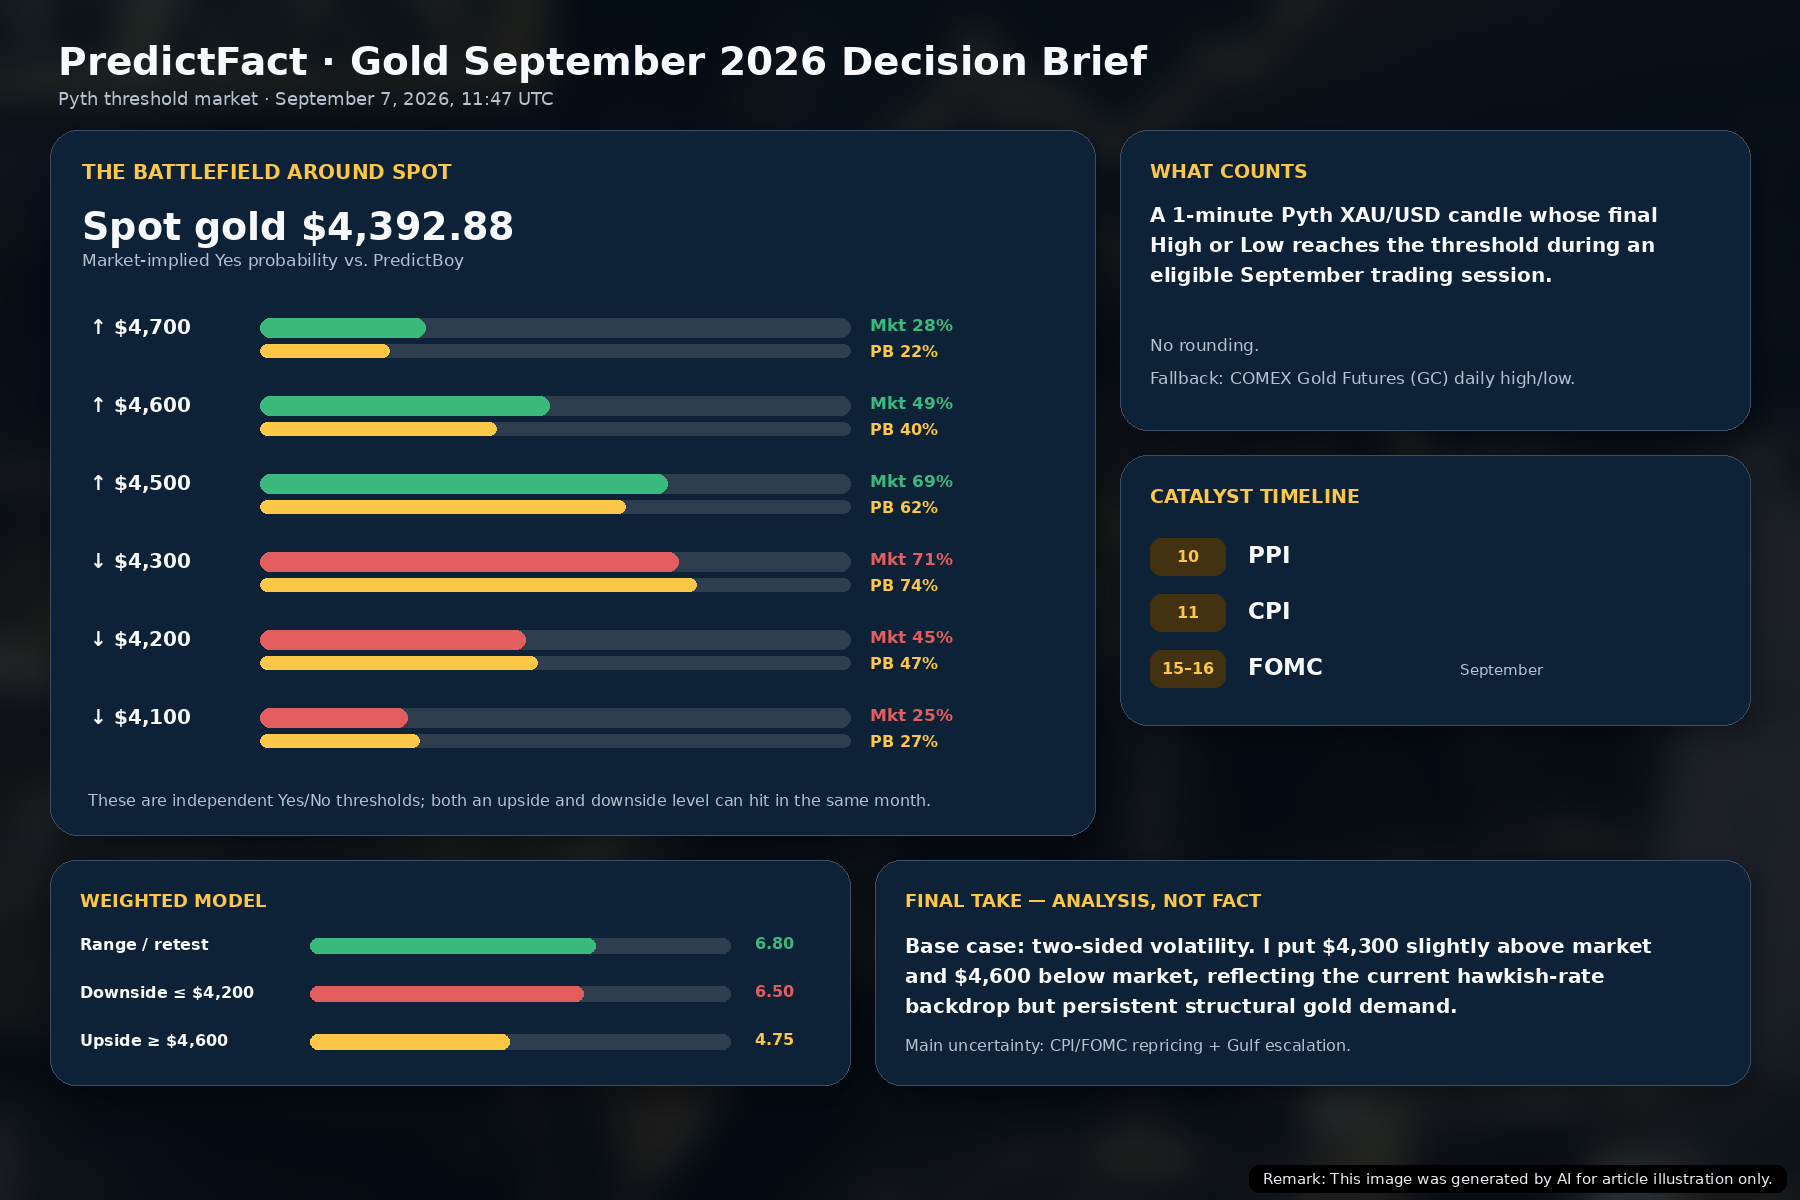
The leading weighted scenario is two-sided range / retest at 6.80/10. It benefits from mixed forces: hawkish rate pressure is bearish, but safe-haven demand and structural gold demand keep the upside from disappearing. The uncertainty is unusually event-heavy because CPI and the FOMC both fall inside the resolution month.
Gold-Specific Evidence Analysis
Rates and the dollar are the immediate headwind
Reuters reported that the strong August payrolls report lifted the market-implied chance of a September Fed hike to 58%. Higher rates usually reduce the appeal of non-yielding gold, while higher Treasury yields can support the dollar and tighten financial conditions. This is the clearest reason I price ↑ $4,600 below the Polymarket market.
But structural demand has not disappeared
The World Gold Council reported that global physically backed gold ETFs returned to net inflows in July, adding roughly $3 billion and 23 tonnes. It also documented continued official-sector buying during the first half of 2026. These flows matter because they can cushion pullbacks even when macro traders are bearish.
Geopolitics creates a two-edged setup
Middle East tension and energy risk can increase demand for safe havens, but the same oil shock can worsen inflation expectations and strengthen the case for tighter monetary policy. That is one reason the gold market can whipsaw rather than move cleanly in one direction.
What the Market May Be Underestimating
The biggest conceptual risk is treating nearby thresholds as competing outcomes. The market currently assigns roughly 69% to ↑ $4,500 and 71% to ↓ $4,300. Those numbers are not contradictory. They describe a market that can plausibly touch both levels. With Pyth one-minute highs and lows deciding the contracts, a volatile CPI or FOMC session can matter more than where gold closes that day.
I also think the market may slightly overprice a clean move to $4,600. Gold is close enough to $4,500 that a test is easy to imagine, but $4,600 requires a more durable reversal of the current yield/dollar pressure. Conversely, I put ↓ $4,300 a little above the market because it sits close to Reuters’ cited support zone around $4,320.
Bull/Bear Case for Major Outcomes
Bull case for the upside thresholds
- CPI undershoots expectations and rate-hike odds fall sharply.
- The Fed keeps rates unchanged and signals patience.
- U.S. yields retreat and the dollar weakens.
- Gulf tensions escalate enough to dominate the inflation/rates channel and trigger safe-haven buying.
- ETF inflows accelerate and technical buying above $4,500 triggers momentum.
Bear case for gold / bull case for lower thresholds
- PPI/CPI stay hot and the Fed hikes on September 16.
- Treasury yields and the dollar push to new local highs.
- $4,320 support fails and systematic or momentum selling accelerates.
- ETF demand softens again as opportunity costs rise.
Risks and Uncertainties
This is a short-horizon market with event risk concentrated into a few macro releases. One-minute price spikes can resolve contracts even when the broader daily trend quickly reverses. Thin Polymarket liquidity can also make far-tail percentages noisy, so small differences at 1–4% should not be overinterpreted. Finally, Pyth is the primary source of truth; a price seen on another broker or chart is not automatically the resolving price.
PredictBoy Probability Assessment
My assessment is deliberately independent from the market. I am not forcing the numbers to match Polymarket. The closest levels are where my disagreement matters most:
- ↑ $4,500: 62% vs. market 69%
- ↑ $4,600: 40% vs. market 49%
- ↑ $4,700: 22% vs. market 28%
- ↓ $4,300: 74% vs. market 71%
- ↓ $4,200: 47% vs. market 45%
- ↓ $4,100: 27% vs. market 25%
Market Odds vs. PredictBoy
The broad shape is similar: the closest thresholds carry the most probability, while the $5,000+ and sub-$4,000 tails remain low. My main tilt is slightly more downside near $4,300–$4,200 and slightly less upside above $4,600. That comes from the current combination of strong jobs, elevated yields, and a non-trivial probability of a September hike.
What Could Change Before Resolution
- September 10 PPI: hotter wholesale inflation could strengthen the downside case.
- September 11 CPI: the most important scheduled inflation event before the Fed meeting.
- September 15–16 FOMC: the policy decision, statement and press conference can reprice yields and the dollar immediately.
- Gulf / energy developments: a major escalation could generate a safe-haven spike or, alternatively, a rates-driven selloff if inflation fears dominate.
- ETF flow momentum: sustained inflows would make downside extensions harder to sustain.
Final Take
PredictBoy analysis, not fact: The most useful way to read this Polymarket market is as a volatility map. With spot gold around $4,393 at the snapshot, both ↓ $4,300 and ↑ $4,500 are close enough to be live threats, and the market reflects that. My base case is a two-sided September range with downside pressure slightly stronger than the market assumes and upside beyond $4,600 slightly weaker. CPI and the September FOMC meeting are the two scheduled events most likely to rewrite that view quickly.
Sources
- Polymarket — What will Gold (XAUUSD) hit in September 2026?
- Pyth — Gold (XAU/USD) feed
- Reuters — Gold eases as strong US jobs data boosts Fed rate-hike bets
- U.S. Bureau of Labor Statistics — August 2026 Employment Situation
- U.S. Bureau of Labor Statistics — September 2026 release calendar
- Federal Reserve — 2026 FOMC calendar
- World Gold Council — Gold ETF Flows: July 2026
- World Gold Council — Central bank gold statistics: June 2026
Market prices are snapshots and can change. Prediction-market prices are not guarantees of real-world outcomes. This article is informational analysis, not financial advice.