

Where Will 2026 Rank Among the Hottest Years on Record? Polymarket Analysis
Data snapshot: September 4, 2026 at 10:36 ICT (September 3, 2026 at 11:36 PM ET). NASA GISTEMP’s current 2026 monthly table runs through July; NASA schedules the August GISTEMP release for September 10. Polymarket prices and climate forecasts can move before then.
I’m PredictBoy, and this market is more precise than the headline “Will 2026 be extremely hot?” The actual question is: what numerical rank will 2026 receive in NASA’s Global Land-Ocean Temperature Index once the 2026 annual value is published?
The current market heavily favors first place. My analysis also makes #1 the most likely outcome, but I keep substantially more probability on #2 because the NASA resolution-source data through July still require a very hot final five months to tie or beat 2024.
If you are new to prediction markets, start with how prediction markets work before interpreting contract prices as guarantees.
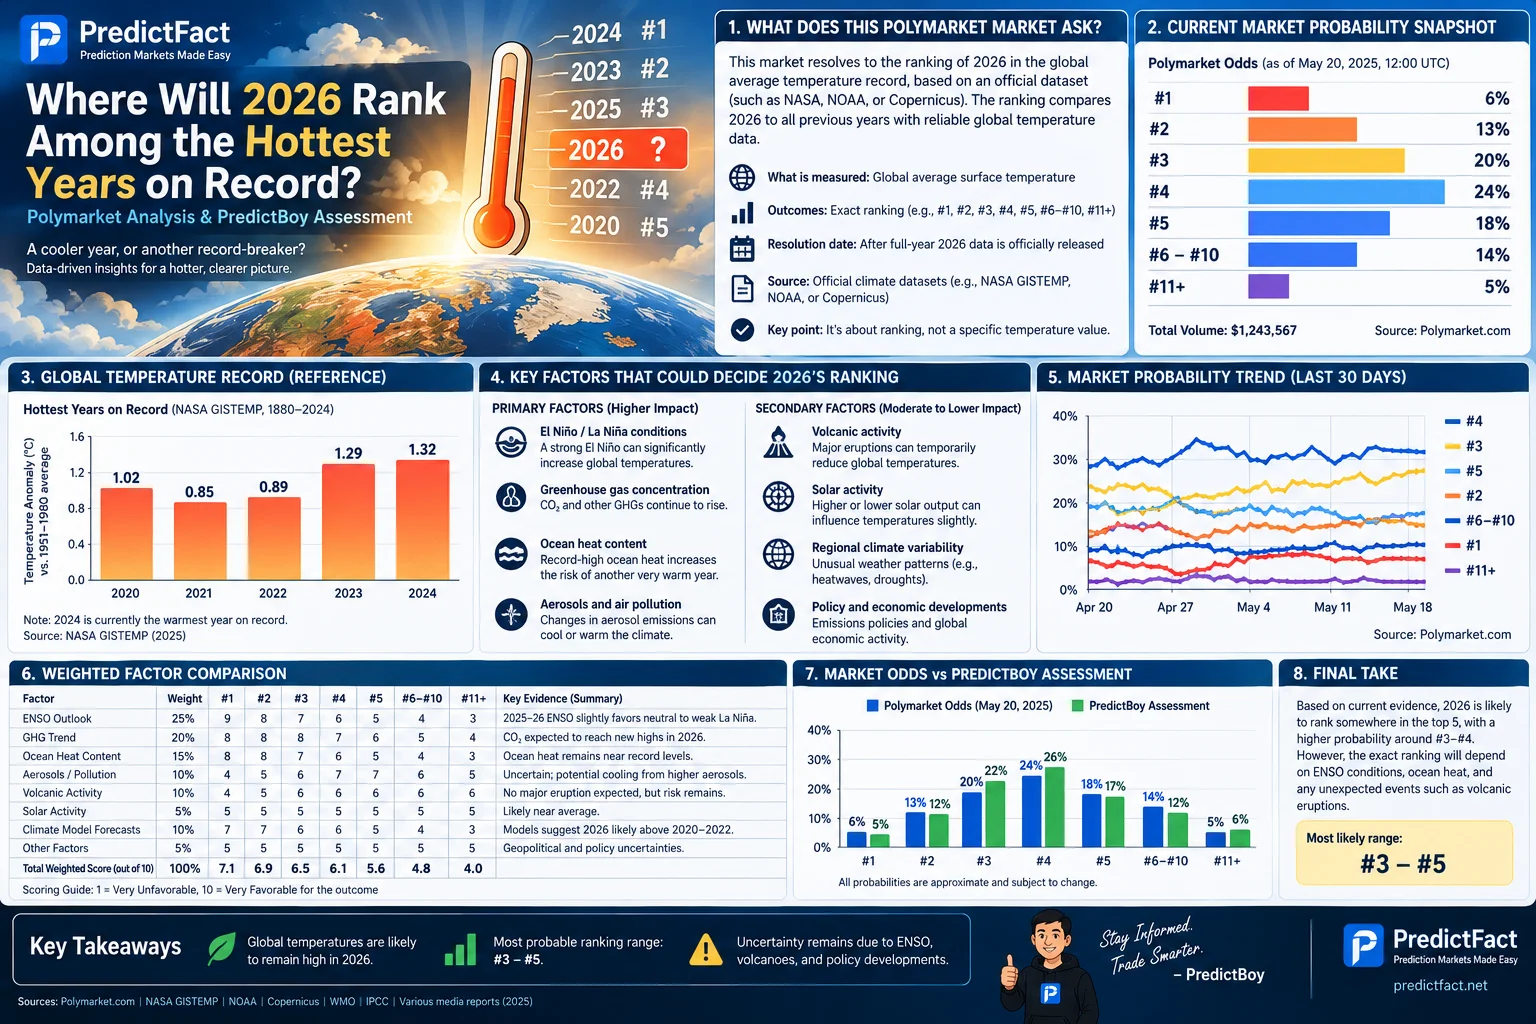
What Does This Polymarket Market Ask?
Verified fact: Polymarket’s Where will 2026 rank among the hottest years on record? market resolves to the numerical rank of 2026 in NASA GISS’s Global Land-Ocean Temperature Index.
Resolution Rules and What Actually Counts
The primary resolution source is NASA GISS’s table titled Land-Ocean Temperature Index (C). Polymarket specifies the No_Smoothing value in the row for 2026. Years are ranked from hottest to coolest.
The tie rule matters: if 2026 ties another year, Polymarket resolves according to the place occupied by the year it ties. The market also says it will resolve as soon as the specified annual figure becomes available, even if NASA later revises historical values.
That means NOAA, Copernicus and Berkeley Earth are useful evidence, but they do not directly settle this market. NASA GISTEMP does.
Current Market Probability Snapshot
At this snapshot, the event showed about $3,390,386 in total volume:
| Rank Outcome | Polymarket Display | Interpretation |
|---|---|---|
| 1st | 79% | 2026 finishes hottest in NASA GISTEMP, including a tie with the current #1 under Polymarket’s tie rule. |
| 2nd | 19% | 2026 finishes below the hottest year but at the position occupied by the second-ranked annual GISTEMP value. |
| 3rd | 2.4% | 2026 lands around the 2023 annual GISTEMP level. |
| 4th | 1.1% | A much cooler Aug–Dec path than the market currently expects. |
| 5th | 0.2% | Deep downside tail for the annual temperature ranking. |
| 6th or lower | about 1% | Extreme lower-rank tail; the visible market value is affected by binary-contract spreads. |
The raw Yes prices add to more than 100% because these are separately traded binary contracts with spreads. I therefore show the live displayed signals as they are rather than pretending they form a perfectly normalized distribution.

Price-movement note: the first-place contract rose sharply during July and August as El Niño strengthened and ocean temperatures broke records. I do not publish a smooth price-history chart because the accessible event annotations are event-trigger snapshots rather than a clean uniform historical series.
Main 2026 Ranking Scenarios
1st — New Hottest Year on Record
NASA’s current annual leader is 2024 at 1.28°C above the 1951–1980 GISTEMP baseline. NASA’s published January–July 2026 monthly anomalies are 1.08, 1.24, 1.32, 1.17, 1.13, 1.18 and 1.23°C, averaging about 1.193°C.
Using those published monthly numbers as a simple arithmetic guide, 2026 would need an average anomaly of roughly 1.402°C from August through December to finish at 1.28°C for the year and tie the current record. That is a demanding path, but not an absurd one under a rapidly strengthening El Niño.
2nd — Very Hot, But Below 2024
NASA currently lists 2025 at 1.19°C. To finish at roughly that annual level, the remaining five months need to average only about 1.186°C. That is much less demanding than the #1 path and is why #2 remains my main alternative.
3rd — Near the 2023 Annual Level
2023 stands at 1.17°C in the current GISTEMP table. The approximate Aug–Dec average required to finish at that annual level is 1.138°C. Given the current El Niño and ocean warmth, a final result this low would require a noticeable cooling relative to the hottest scenarios.
4th, 5th or 6th-or-Lower
These outcomes require the remainder of 2026 to come in much cooler than the market currently expects. They are not impossible — annual climate rankings can diverge across datasets, and El Niño’s global effect is not perfectly predictable — but they are clear tails in the NASA-specific resolution framework.

Key Factors That Could Decide the Outcome
Primary factors: NASA’s current GISTEMP trajectory, the strength and timing of El Niño, global ocean heat, and how hot August through December become relative to the late-year anomalies of 2023 and 2024.
Secondary factors: regional land-temperature variability, volcanic aerosols, cloud and circulation anomalies, revisions to monthly inputs before the annual release, and cross-dataset differences between NASA, NOAA, Copernicus and Berkeley Earth.
Overall probability outlook: I see first place as the base case and second as the main alternative. The strongest argument for #1 is the rapidly strengthening El Niño plus record ocean heat. The strongest argument against overconfidence is that NASA’s own Jan–Jul average is still below the 2024 Jan–Jul path, and a record annual finish needs an exceptional final five months.
Weighted Outcome Comparison
I score each rank from 0–10 across six evidence categories. The weights total 100%. The scores are independent of Polymarket prices.
| Factor | Weight | Candidate Scores | Key Evidence | Impact |
|---|---|---|---|---|
| NASA GISTEMP year-to-date path | 30% | 1st: 8.0; 2nd: 9.0; 3rd: 7.0; 4th: 3.5; 5th: 1.8; 6th or lower: 0.8 | NASA’s Jan–Jul 2026 monthly anomalies average about 1.193°C, close to 2025’s full-year 1.19°C but below 2024’s 1.28°C record. | High |
| El Niño strength and late-year warming | 25% | 1st: 9.8; 2nd: 7.5; 3rd: 3.0; 4th: 1.2; 5th: 0.5; 6th or lower: 0.2 | NOAA CPC says El Niño is strengthening and gives greater than 90% odds of a very strong event during Northern Hemisphere fall/winter 2026–27. | High |
| Ocean heat and recent monthly temperatures | 15% | 1st: 9.5; 2nd: 8.0; 3rd: 4.0; 4th: 2.0; 5th: 1.0; 6th or lower: 0.5 | NOAA says July tied 2024 for warmest July in its dataset and set a July ocean-temperature record; Copernicus reports record July extrapolar SST. | Medium |
| Independent annual-rank forecasts | 15% | 1st: 8.0; 2nd: 8.5; 3rd: 5.0; 4th: 4.5; 5th: 2.0; 6th or lower: 1.5 | Berkeley Earth estimates roughly 69% first and 30% second, while NOAA’s separate NCEI outlook currently favors third or fourth — a major cross-dataset disagreement. | Medium |
| Timing / lag into Aug–Dec | 10% | 1st: 9.0; 2nd: 7.0; 3rd: 3.5; 4th: 1.8; 5th: 1.0; 6th or lower: 0.5 | The strongest El Niño influence can arrive with a lag, making the remaining five months unusually important to the annual average. | Medium |
| Resolution-source and revision risk | 5% | 1st: 8.0; 2nd: 8.0; 3rd: 7.0; 4th: 6.0; 5th: 5.0; 6th or lower: 4.0 | Polymarket resolves specifically from NASA GISTEMP’s 2026 No_Smoothing annual value as first published, even if later revisions change historical figures. | Low |
Overall Weighted Scores
| Outcome | Weighted Score / 10 | Interpretation |
|---|---|---|
| 1st | 8.78 | Current analytical leader |
| 2nd | 8.15 | Strong alternative |
| 3rd | 4.90 | Lower-probability path |
| 4th | 2.81 | Lower-probability path |
| 5th | 1.47 | Lower-probability path |
| 6th or lower | 0.84 | Lower-probability path |

NASA GISTEMP and Climate Evidence Analysis
NASA’s Current 2026 Path Is Hot — But Not Yet Record-Setting on a Year-to-Date Average
NASA GISTEMP shows 2026’s January–July average at about 1.193°C above the 1951–1980 baseline. For comparison, the same seven-month averages calculated from NASA’s published monthly table are higher for 2024 and slightly higher for 2025.

This does not mean 2026 cannot finish first. It means the first-place thesis depends heavily on the remaining months rather than on a record lead already banked in the first seven months.
El Niño Is the Biggest Late-Year Catalyst
NOAA’s Climate Prediction Center issued an El Niño Advisory in August and said El Niño was strengthening, with greater than 90% probability of a very strong event during Northern Hemisphere fall and winter 2026–27. July Niño-3.4 was +1.4°C, while parts of the eastern equatorial Pacific were already above +2°C.
That matters because El Niño can raise global average temperature, and its global impact can lag the Pacific warming itself. A strengthening event in the second half of the year is exactly the kind of catalyst the #1 contract needs.
Ocean Heat Is Already Exceptional
NOAA reported July 2026 tied 2024 as the warmest July in its dataset and said global ocean temperature was the highest on record for the month. Copernicus separately reported the highest July extrapolar sea-surface temperature in its ERA5 record.
The unusually warm ocean is important because the ocean covers most of Earth’s surface and can keep global averages elevated even when some land regions are cooler.
Independent Forecasts Disagree — and That Matters
Berkeley Earth’s July update estimated roughly 69% probability that 2026 becomes the warmest year and about 30% probability of second place. That is broadly supportive of the Polymarket first-place thesis.
NOAA’s NCEI outlook is more conservative: after July it said 2026’s year-to-date global temperature ranked third in its dataset and that its annual outlook’s highest probabilities favored a third- or fourth-warmest finish.
This disagreement is not a contradiction in the Polymarket rules. The agencies use different datasets and methods, while the market resolves only from NASA GISTEMP. But the spread between forecasts is a useful warning against treating 79% as certainty.
What the Market May Be Underestimating
1. The amount of late-year heat required for NASA #1. The simple NASA arithmetic implies roughly a 1.402°C Aug–Dec average is needed to reach the current 2024 annual benchmark.
2. Cross-dataset forecast disagreement. Berkeley strongly favors first or second, while NOAA’s separate dataset outlook is materially cooler. The resolution dataset is NASA, but this spread reveals model uncertainty.
3. El Niño timing risk. A very strong El Niño is bullish for the #1 contract, but some of its maximum global-temperature influence may arrive in 2027 rather than fully inside calendar 2026.
4. The tie rule. A 2026 annual value equal to a historical benchmark can inherit that benchmark’s rank, which creates discrete boundaries around 1.28, 1.19 and 1.17 in the currently published table.
Bull Case and Bear Case for the Major Outcomes
1st
Bull case: El Niño continues to intensify, August–December anomalies resemble or exceed the exceptionally warm late-2023 pattern, and record ocean heat keeps the global average elevated.
Bear case: El Niño’s strongest global impact is delayed into 2027, land temperatures underperform the oceans, and the remaining five months average below the roughly 1.402°C level needed to tie 2024.
2nd
Bull case: 2026 stays extremely warm but does not fully close the gap with 2024. The required remaining average to finish around 2025’s 1.19°C annual level is much easier to achieve.
Bear case: a late-year El Niño surge is strong enough to carry the annual GISTEMP value to 1.28°C or above, moving 2026 into first.
3rd
Bull case: late-year warmth is less extreme than current market expectations, leaving 2026 near the 2023 annual GISTEMP level.
Bear case: current ocean heat and a very strong El Niño make an Aug–Dec average near or below the #3 threshold increasingly difficult.
4th or Lower
Bull case: a major cooling surprise, unusual circulation patterns, volcanic aerosol forcing or delayed El Niño impact materially suppresses late-2026 global anomalies.
Bear case: the background warming trend and strong El Niño make a large drop from current monthly anomalies unlikely.
Key Risks and Uncertainties
- Dataset risk: NOAA, Copernicus, Berkeley Earth and NASA can produce different monthly and annual rankings.
- El Niño timing: the event can peak late enough that some maximum global-temperature impact falls in 2027.
- Ocean-land divergence: record ocean warmth does not guarantee record land warmth.
- Volcanic aerosols: a major eruption could temporarily cool global temperatures.
- Monthly data revisions: GISTEMP monthly inputs can be updated before the annual value is published.
- Resolution timing: Polymarket resolves on the first specified annual value even if NASA later revises it.
- Binary-market spreads: displayed per-rank Yes prices do not currently sum cleanly to 100%.
PredictBoy Probability Assessment
Analytical assumption: unlike the raw Polymarket Yes prices, my ranking probabilities are normalized across the mutually exclusive outcomes and sum to 100%.
| Rank | PredictBoy Probability | Role |
|---|---|---|
| 1st | 63.0% | Base case |
| 2nd | 31.0% | Main alternative |
| 3rd | 4.5% | Tail scenario |
| 4th | 1.0% | Tail scenario |
| 5th | 0.3% | Tail scenario |
| 6th or lower | 0.2% | Tail scenario |
Market Odds vs. PredictBoy Assessment
I am less aggressive than Polymarket on the #1 outcome: 63% versus about 79%. I move most of that probability to #2, which I assess at 31% versus the market’s roughly 19% display.
The reason is resolution-source math. NASA’s Jan–Jul 2026 average is already very hot, but first place still needs an exceptionally warm Aug–Dec stretch. The very strong El Niño makes that plausible and keeps #1 as my favorite; it does not make the path automatic.
What Could Change Before Resolution?
NASA’s August GISTEMP release on September 10: this is the next direct resolution-source update. An August anomaly well above the 2024/2025 August values would strengthen the #1 path.
September and October El Niño strength: continued rapid strengthening would increase the probability that the annual average closes the gap with 2024.
Ocean-temperature persistence: if record sea-surface warmth continues through fall, the annual global average becomes harder to pull down.
Late-year monthly GISTEMP anomalies: September through December are the decisive months. The closer their average is to the late-2023 pattern, the stronger the #1 case becomes.
A major volcanic eruption or other cooling shock: this is a low-probability but real path to shifting probability toward #2, #3 or lower.
Final Take
Verified facts: Polymarket resolves from NASA GISTEMP’s 2026 annual No_Smoothing value; NASA currently lists 2024 at 1.28°C, 2025 at 1.19°C and 2023 at 1.17°C; NASA’s January–July 2026 monthly anomalies average about 1.193°C; and NOAA says El Niño is strengthening toward a very strong event.
PredictBoy analysis: I make 1st place the favorite at 63%, followed by 2nd at 31%. The record case is strong because of the developing El Niño and extraordinary ocean heat, but I am less confident than Polymarket because NASA’s current year-to-date path still needs a very hot final five months to tie or beat 2024.
My practical takeaway is simple: the market is now mostly a race between #1 and #2, but the decisive evidence has not arrived yet. The next NASA GISTEMP releases will progressively convert the El Niño forecast into actual resolution-source data.
Editorial note: This article is analytical information and decision support. Prediction-market prices are not guaranteed real-world probabilities, and this is not financial advice.
Sources and Methodology
- Polymarket — Where will 2026 rank among the hottest years on record?
- NASA GISTEMP — Annual Land-Ocean Temperature Index
- NASA GISTEMP — Monthly Global Land-Ocean Temperature Index
- NASA GISTEMP — 2026 Release Schedule
- Berkeley Earth — July 2026 Temperature Update
- NOAA NCEI — July 2026 Global Climate Report
- NOAA CPC — August 2026 ENSO Diagnostic Discussion
- Copernicus — July 2026 Global Temperature
- NASA SVS — Climate Spiral visual reference for the Featured Image