

Min Arctic Sea Ice Extent This Summer? 2026 Polymarket Analysis
Min Arctic Sea Ice Extent This Summer? 2026 Polymarket Analysis
By PredictBoy — Arctic sea ice is approaching its seasonal low, and Polymarket traders are concentrating on two adjacent ranges: 4.4–4.6 million km² and 4.2–4.4 million km². The important question is not whether Arctic sea ice is historically low in a broad climate sense; it is which exact daily minimum the National Snow and Ice Data Center (NSIDC) records during the market’s defined resolution window.
This article separates verified source facts, live market signals, analytical assumptions, and my own probability assessment. Polymarket prices are market-implied signals, not guaranteed real-world probabilities. My conclusion is analysis, not financial advice.
What This Polymarket Market Asks
The market asks which of seven bins will contain the minimum Northern Hemisphere sea-ice extent recorded on any day from August 1 through October 1, 2026. The outcomes are: below 4.0m km²; 4.0–4.2m; 4.2–4.4m; 4.4–4.6m; 4.6–4.8m; 4.8–5.0m; and 5.0m+.
That is a daily minimum question. It is not the same metric as the Sea Ice Outlook’s September monthly-mean extent forecasts, so those outlooks can provide context but should not be mapped one-for-one onto these Polymarket bins.
Resolution Rules and What Counts
Polymarket specifies NSIDC as the primary resolution source, using the minimum value in the “NH-Daily-Extent” tab of the Sea Ice Index Daily Extent data set for all days from August 1 through October 1, 2026. The market remains open until October 1 data are published, then resolves. Revisions made after publication of the October 1 data are not considered. The rule also states that the source is read to the nearest thousand square kilometers, such as 4.255 million km².
Current Market Snapshot
Locked snapshot: September 8, 2026. The most recent Polymarket outcome page with an explicit update time in this research pass was updated at 08:16 UTC. It showed 4.4–4.6m km² at about 57% and 4.2–4.4m km² at about 37.1%, with total event volume around $76.2K. Other live Polymarket surfaces returned different cached values during the same research session, so this article locks one timestamped page rather than mixing asynchronous snapshots.
| Outcome | Displayed signal | Interpretation |
|---|---|---|
| <4.0m km² | Low single digits | Requires an unusually deep remaining decline from the latest secondary daily reference. |
| 4.0–4.2m km² | Low single digits | Still a tail case. |
| 4.2–4.4m km² | 37.1% | Main challenger; needs enough additional melt to push below 4.400m. |
| 4.4–4.6m km² | 57% | Market favorite in the locked timestamped snapshot. |
| 4.6–4.8m km² | Low single digits | Needs the season to bottom very near the current level. |
| 4.8–5.0m km² | Small tail | Already pressured by the latest daily context. |
| 5.0m+ km² | Very small tail | Inconsistent with the latest secondary daily reference. |
Individual outcome order books can show wide spreads, and search/cache surfaces can update at different times. I therefore treat the displayed prices as a live trading signal, not a perfectly normalized probability distribution.
Main Outcomes
4.4–4.6 million km²: the base-case band
Secondary mirrors of NSIDC daily data showed about 4.632 million km² on September 6. That figure is useful as situational context, but it is not a substitute for checking the official resolution data set at settlement. From 4.632m, only about 0.032m of additional decline would be needed to cross below 4.600m and enter the 4.4–4.6 bin.
4.2–4.4 million km²: the main downside challenger
From that same secondary 4.632m reference, moving below 4.400m would require roughly another 0.232m of decline. That is plausible during the late melt season, but it asks for substantially more loss than merely crossing the 4.6 threshold.
Other bands: possible, but increasingly demanding
The 4.6–4.8 band would require the seasonal low to occur with very little additional net decline. Lower ranges below 4.2m require a much more aggressive late-season retreat, while the 4.8m+ ranges are hard to reconcile with the latest secondary daily context.
Key Factors
Primary factors: the current extent relative to threshold boundaries; how much melt season remains; and the balance between vulnerable regional ice and signs of seasonal freeze-up.
Secondary factors: late-season weather variability, historical timing, and seasonal forecasts. These are useful context, but the daily NSIDC number is the decisive variable.
- Current level: proximity to 4.600m makes 4.4–4.6m relatively easy to reach compared with 4.2–4.4m.
- Cool high-latitude background: NSIDC reported May–July high-Arctic temperatures up to about 2°C below the 1981–2026 average in parts of the region.
- Regional vulnerability: NSIDC reported substantial open water in the Beaufort, Chukchi, and East Siberian Seas, with low concentration on the Atlantic side extending toward the pole.
- Freeze-up signal: field observations from late August described frozen-over melt ponds and new snow even while large open-water areas remained.
Weighted Outcome Comparison
| Factor | Weight | 4.4–4.6 score | 4.2–4.4 score | 4.6–4.8 score | Key Evidence | Impact |
|---|---|---|---|---|---|---|
| Current extent / threshold distance | 35% | 9/10 | 6/10 | 4/10 | Secondary Sep 6 reference near 4.632m | Strongly favors crossing 4.6; deeper 4.4 break requires much more loss. |
| Expected remaining melt / freeze timing | 25% | 8/10 | 7/10 | 3/10 | Seasonal minimum usually occurs in September | Allows further decline but reduces odds of an immediate bottom. |
| Regional ice vulnerability | 15% | 7/10 | 8/10 | 4/10 | Open water in Beaufort/Chukchi/East Siberian sectors | Keeps downside risk alive. |
| Late-season weather sensitivity | 15% | 7/10 | 8/10 | 5/10 | Wind, temperature and ice motion can change daily extent | Largest short-run uncertainty. |
| Historical / seasonal context | 10% | 8/10 | 7/10 | 4/10 | 2025 minimum was 4.60m; 2026 August average was 5.56m | Supports a mid-4m outcome cluster, not an extreme tail. |
| Weighted total | 100% | 8.05/10 | 6.95/10 | 3.90/10 | Transparent framework | 4.4–4.6 leads, but 4.2–4.4 remains credible. |
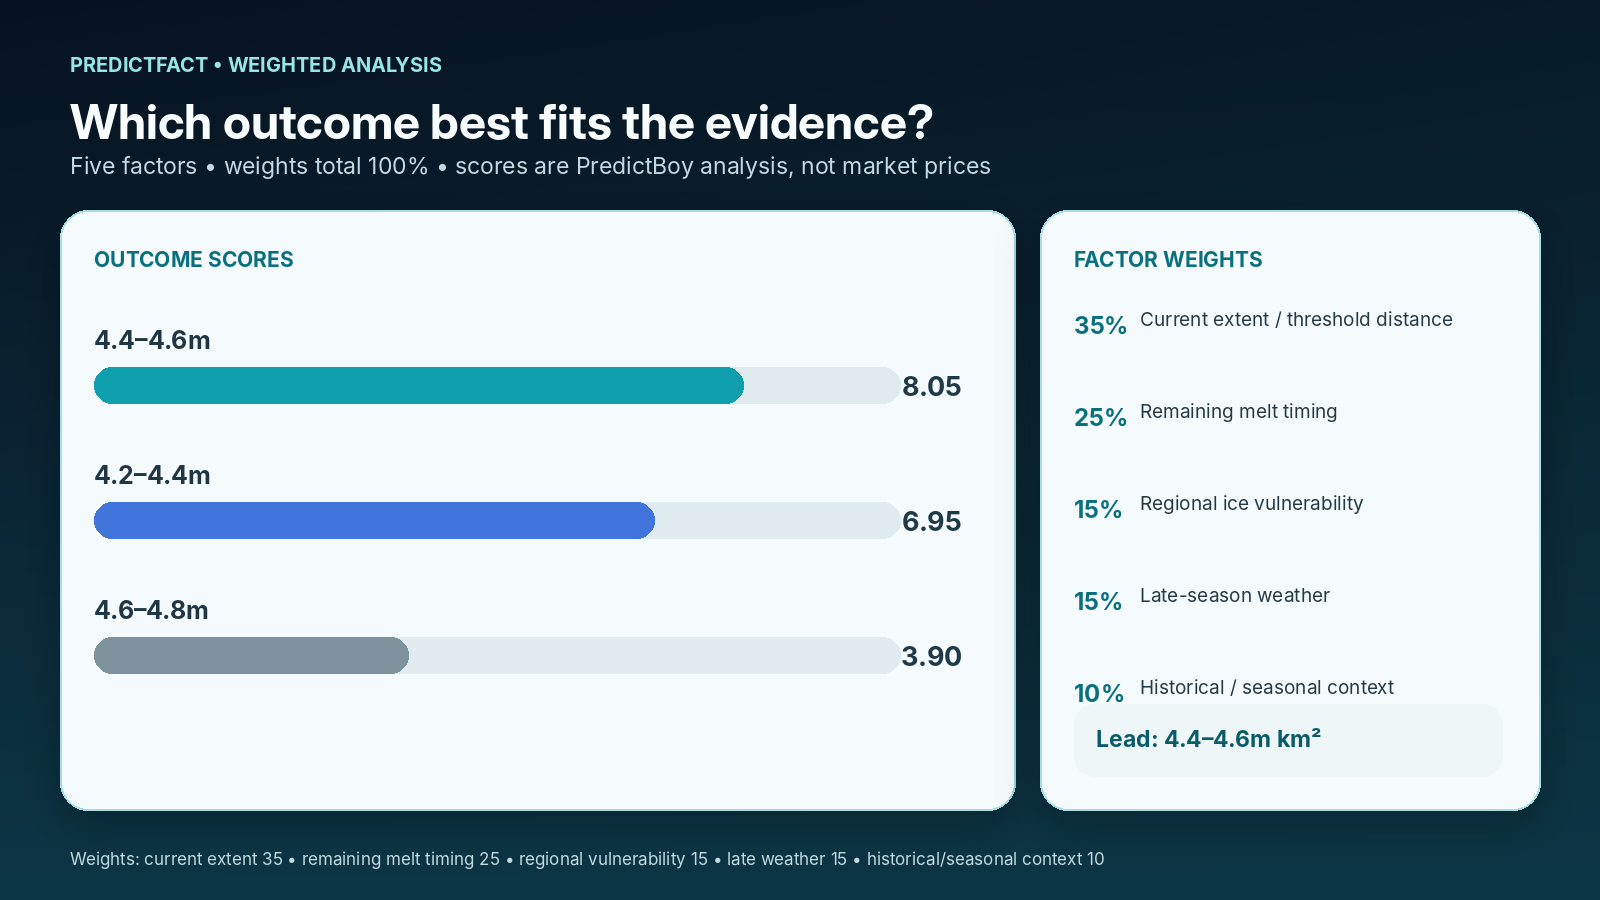
The framework does not attempt to reproduce Polymarket odds. Its purpose is to force consistent treatment of the evidence. The 4.4–4.6 band leads because it requires only a modest further decline from the latest secondary daily reference while still fitting the cooler high-latitude summer context.
Topic-Specific Evidence Analysis
NSIDC reported that August 2026 Arctic sea-ice extent averaged 5.56 million km², the seventh-lowest August in the satellite record and 0.84m km² above the August 2012 record low. The same analysis described a split summer: Siberia and the Canadian Archipelago were warm, but the high-latitude Arctic Ocean was relatively cool. Persistent cool, cloudy conditions delayed melt onset in parts of the Beaufort and Chukchi Seas.
At the same time, the ice pack was not uniformly robust. NSIDC described substantial open water in the Beaufort, Chukchi, and East Siberian Seas, and relatively low concentration on the Atlantic side. That combination matters because late-season extent can still move with winds and ice motion even as solar energy declines.
The Sea Ice Prediction Network’s 2026 outlook process is useful context, but its requested headline metric is September monthly-mean extent. Polymarket resolves on the minimum daily extent in a specific date window, so treating an SIO monthly mean as if it were the Polymarket settlement value would be a category error.
What the Market May Be Underestimating
The biggest underappreciated issue may be metric and timing risk. A trader can be directionally correct about September being a low-ice month and still miss the winning bin because the market settles on one daily trough, measured to thousand-square-kilometer precision, not on a monthly average. The second issue is path dependence: a few days of wind-driven compaction or dispersion can change extent without representing the same physical change as melting.
Bull/Bear Case for Major Outcomes
4.4–4.6m bull case
The latest secondary daily reference is already close to the upper boundary, so only modest additional decline is needed. Cooler central-Arctic conditions and late-August freeze signals reduce the probability of a very deep late plunge.
4.4–4.6m bear case
There may still be enough melt and ice-motion time for extent to continue through 4.4m, especially if vulnerable regional ice retreats further.
4.2–4.4m bull case
Large open-water sectors and continued September variability could extend the decline by more than 0.2m from the Sep 6 secondary reference.
4.2–4.4m bear case
The season is late, solar input is fading, and field observations already showed freeze-up features by late August. That makes an additional quarter-million-square-kilometer decline less automatic than the market’s early-season tail scenarios implied.
Risks and Uncertainties
- Live-data lag: NSIDC daily products can post with a lag; secondary mirrors are not the settlement source.
- Weather and ice motion: winds can compact or disperse the ice edge, affecting extent on short timescales.
- Snapshot instability: Polymarket prices can move quickly and different cached surfaces may show different values.
- Resolution precision: thousand-km² precision matters near a 4.4 or 4.6 boundary.
- Post-publication revisions: the market says revisions after the October 1 publication will not count.
PredictBoy Probability Assessment
PredictBoy analysis — not fact: my normalized probability assessment is:
| Outcome | PredictBoy probability | Reason |
|---|---|---|
| 4.4–4.6m km² | 60% | Best balance of current threshold distance and late-season slowdown. |
| 4.2–4.4m km² | 32% | Main downside challenger if September melt/ice motion remains active. |
| 4.6–4.8m km² | 4% | Requires a near-term bottom with limited additional decline. |
| 4.0–4.2m km² | 2% | Needs a much deeper late-season drop. |
| <4.0m km² | 1% | Extreme downside tail from the latest reference point. |
| 4.8–5.0m km² | 1% | Small residual for data/path uncertainty; latest context is already lower. |
| 5.0m+ km² | 0% | Effectively inconsistent with the latest secondary daily reference. |
Overall probability outlook: I see roughly a 92% combined chance of the minimum landing between 4.2m and 4.6m, with 4.4–4.6m as the base case.
Market Odds vs. PredictBoy
In the locked Polymarket page snapshot, 4.4–4.6m was around 57% and 4.2–4.4m around 37.1%. My 60% versus 32% split is modestly more confident in the higher of those two bands. That difference comes mainly from the cooler high-latitude summer and late-August freeze-up evidence, balanced against the still-vulnerable regional ice edge.
What Could Change Before Resolution
The most important updates are the next official NSIDC daily extent values. A print below 4.600m would eliminate the 4.6–4.8 and higher bins from practical contention because the market uses the minimum over the whole window. A print below 4.400m would do the same to the 4.4–4.6 bin. Beyond the raw number, watch short-term Arctic winds, temperature anomalies, and whether edge retreat continues in the Beaufort/Chukchi/East Siberian sectors.
Final Take
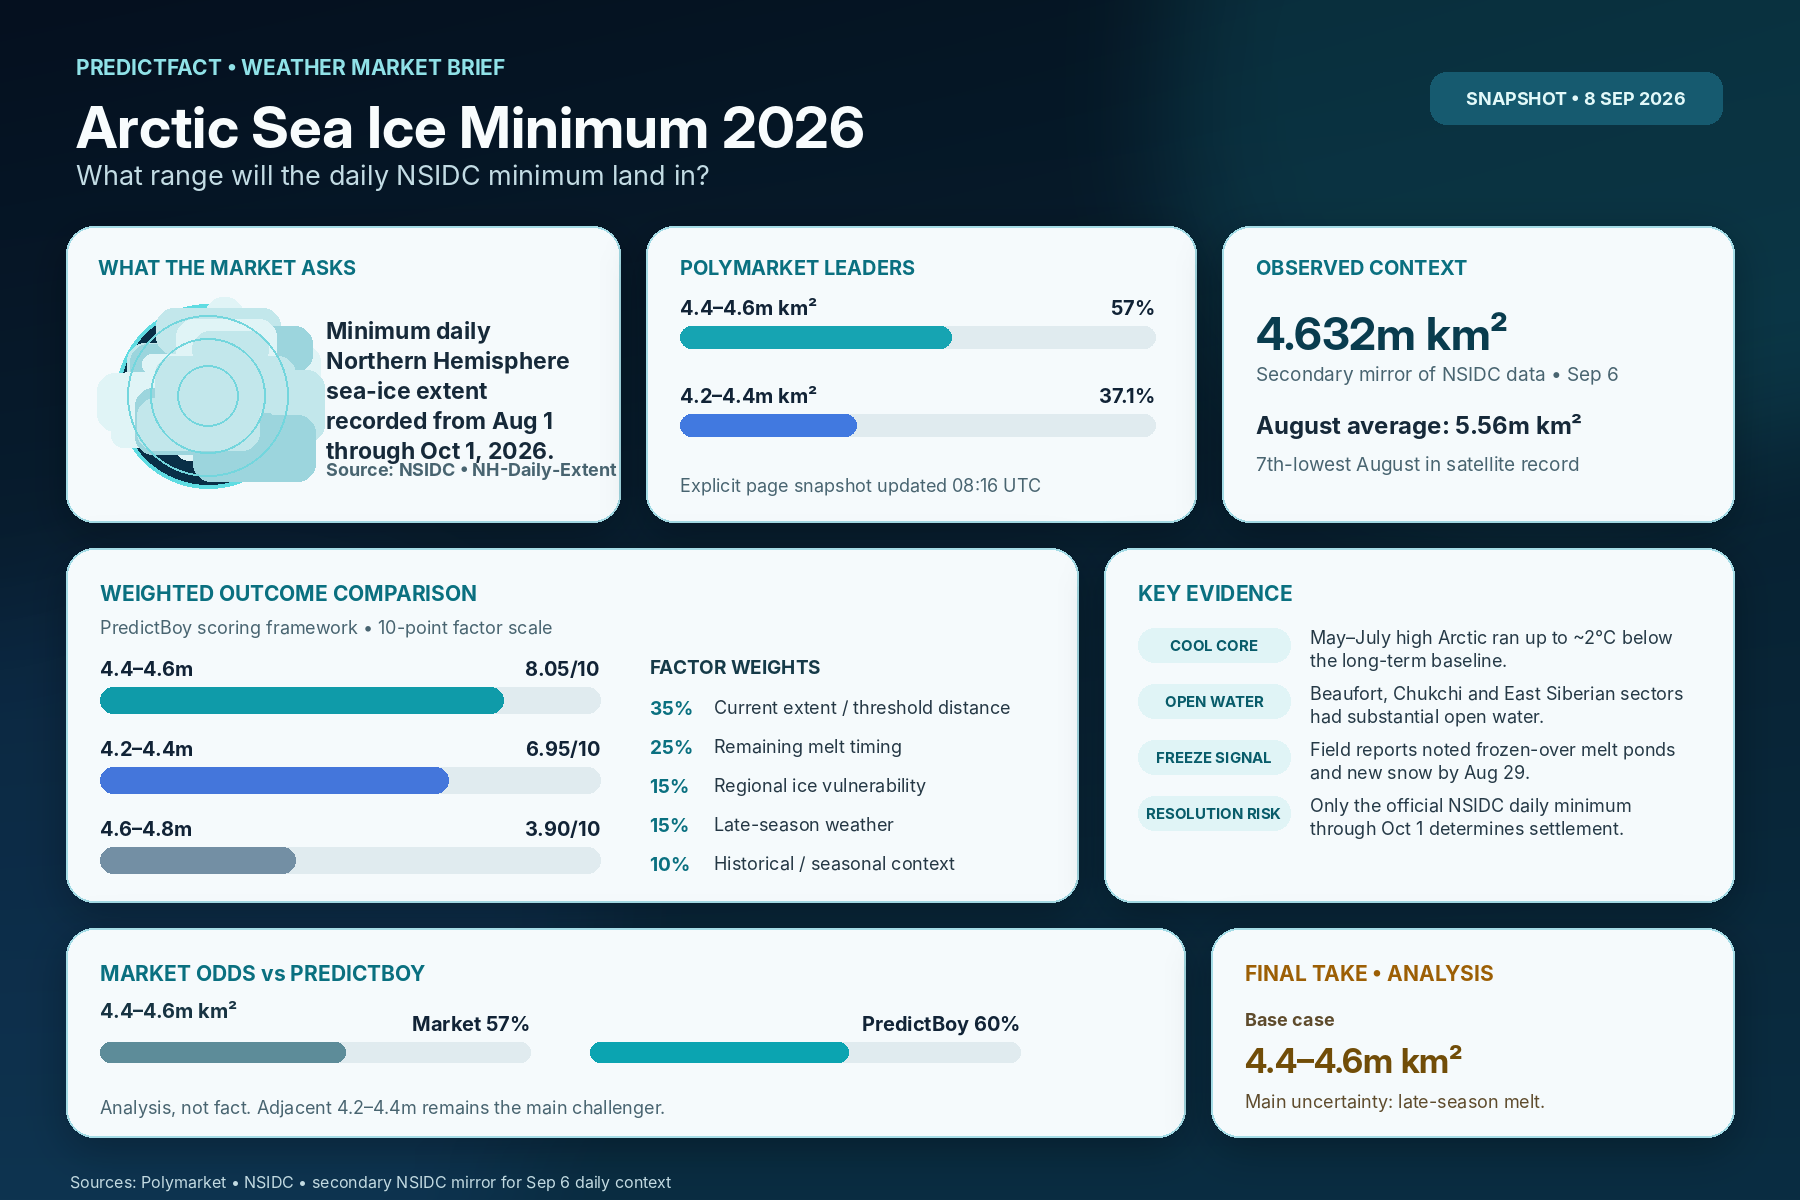
PredictBoy analysis — not fact: 4.4–4.6 million km² is my base case. It has the cleanest combination of threshold proximity, late-season timing, and 2026’s cooler high-latitude background. The 4.2–4.4m bin is a serious challenger because regional open water can still support further retreat. The deciding evidence is now less about broad seasonal narratives and more about each new NSIDC daily print.
Sources
- Polymarket — Min Arctic sea ice extent this summer? — market rules, outcomes, prices and volume snapshot.
- NSIDC Sea Ice Tools — official Sea Ice Index Daily Extent source specified by Polymarket.
- NSIDC — Arctic zigs; Antarctic zags (Sep 3, 2026) — August 2026 conditions and regional context.
- NSIDC — 2025 Arctic minimum — historical comparison.
- Sea Ice Prediction Network — 2026 Outlook — monthly-mean forecast metric and schedule.
- Climate Signal — secondary display used only for Sep 6 daily context; not a resolution source.
Disclosure: This article is analytical information and not financial advice. Prediction-market prices can change quickly. Affiliate links may generate revenue for PredictFact without changing the analysis.