

Nvidia Market Cap End of 2026: Polymarket Odds, Valuation Scenarios and PredictBoy Analysis
Nvidia Market Cap End of 2026: Polymarket Odds, Valuation Scenarios and PredictBoy Analysis
By PredictBoy — Nvidia enters the final stretch of 2026 as the world’s largest public company and the central supplier to the AI infrastructure boom. The prediction market is not asking whether Nvidia remains a strong business; it asks which market-cap bracket Nvidia occupies at the close of the final regular trading day of 2026.
This analysis separates verified company/SEC data, Polymarket-implied prices, analytical assumptions and my interpretation. Market prices are not guarantees, and this article is analytical information rather than financial advice.
What This Polymarket Market Asks
The market divides Nvidia’s year-end 2026 public market capitalization into seven mutually exclusive brackets: <$4.0T, $4.0–$4.5T, $4.5–$5.0T, $5.0–$5.5T, $5.5–$6.0T, $6.0–$6.5T and $6.5T+. Only one bracket can resolve Yes.
Resolution Rules and What Counts
- Valuation date: the close of regular trading on the final trading day of 2026.
- Core formula: the final official regular-hours closing price on Nvidia’s primary exchange multiplied by the company’s total number of shares outstanding at the relevant time.
- Share count source: official company filings/disclosures, including SEC filings.
- Boundary rule: if the calculated market cap falls exactly on a bracket boundary, the higher bracket wins.
- Multiple share classes: the rules provide for including all outstanding share classes and stated conversion ratios when necessary to capture total public market capitalization.
- Corporate actions: if Nvidia remains the surviving parent after a merger/acquisition, the methodology is unchanged; if Nvidia ceases to exist independently, pre-transaction public market capitalizations may be used under the market rules.
Current Market Snapshot
Research timestamp: 2026-09-19 20:50 ICT (2026-09-19 13:50 UTC). Polymarket’s page showed about $13,151 in total event volume. Prices and executable order-book quotes can move after this snapshot.
| Market-cap bracket | Polymarket implied probability | Submarket volume | Reading |
|---|---|---|---|
| <$4.00T | 6% | $3,033 | Alternative bracket |
| $4.00-$4.50T | 8% | $854 | Alternative bracket |
| $4.50-$5.00T | 14% | $923 | Alternative bracket |
| $5.00-$5.50T | 21% | $2,031 | Current leading bin |
| $5.50-$6.00T | 18% | $3,313 | Alternative bracket |
| $6.00-$6.50T | 17% | $1,297 | Alternative bracket |
| $6.50T+ | 15% | $1,699 | Alternative bracket |
The largest single bin is $5.0–$5.5T at 21%, but the distribution is broad: the adjacent $5.5–$6.0T and $6.0–$6.5T bins sit at 18% and 17%, while $6.5T+ is 15%. The displayed probabilities sum to 99% because of rounding. With only about $13K of total event volume, the exact percentages deserve more caution than a deep, highly liquid market.
Polymarket’s context panel describes Nvidia at roughly $5.3T. Using the SEC’s August share count of 24.1B strictly as a translation aid, that corresponds to about $219.92 per share. At the same share count, $5.0T would be about $207.47, $5.5T about $228.22, $6.0T about $248.96, and $6.5T about $269.71. Those are mechanical translations, not price targets.
Main Outcomes
$5.0–$5.5T — current market favorite
This range sits close to the market’s current valuation context and requires Nvidia to preserve most of its existing valuation while continuing to execute. It is the least demanding path in terms of multiple expansion, but it still assumes investors remain comfortable with very high absolute valuation and AI capital spending.
$5.5–$6.0T — growth continues to outrun valuation pressure
This bracket requires a modest step-up from today’s approximate level. The case is supported by 106% year-over-year revenue growth, 117% Data Center growth, a $108B Q3 revenue guide and Vera Rubin entering full production. It becomes harder if long-term yields remain high or AI spending expectations are revised down.
$6.0–$6.5T and $6.5T+ — upside execution plus resilient multiple
These outcomes need both continued earnings acceleration and a market willing to sustain or expand the valuation multiple. Rubin execution, AI-cloud demand and hyperscaler capital budgets would need to remain strong enough to offset China constraints, competition and macro discount-rate pressure.
Below $5.0T — compression or growth disappointment
The downside brackets do not require Nvidia’s business to stop growing. They can occur through valuation compression, a weaker macro backdrop, customer capex moderation, supply/deployment delays, competitive pressure, export restrictions or a mix of these. The sub-$4T outcome is the most severe downside bracket.
Key Factors
Primary factors
- AI demand and revenue momentum: Q2 FY27 revenue was $96.2B and Data Center revenue $89.0B; Q3 revenue is guided to $108B ±2%.
- Rubin/Blackwell execution: Blackwell Ultra is driving current growth and Vera Rubin is in full production, with major cloud partners already identified.
- Valuation multiple: year-end market cap depends not just on earnings growth but on what multiple investors are willing to pay under higher rates and inflation.
Secondary factors
- China/export restrictions: Nvidia says it is effectively foreclosed from China’s data-center compute market under current rules.
- Competition: custom silicon, AMD and China’s domestic accelerators can reduce Nvidia’s share or pricing power at the margin.
- Share count: Nvidia repurchased 94M shares in Q2 and still had roughly $99B of authorization remaining; a lower share count mechanically lowers market cap at an unchanged stock price even while buybacks may support per-share value.
- Infrastructure bottlenecks: power, land, financing and customer deployment timing can affect when demand turns into recognized revenue.
Weighted Outcome Comparison
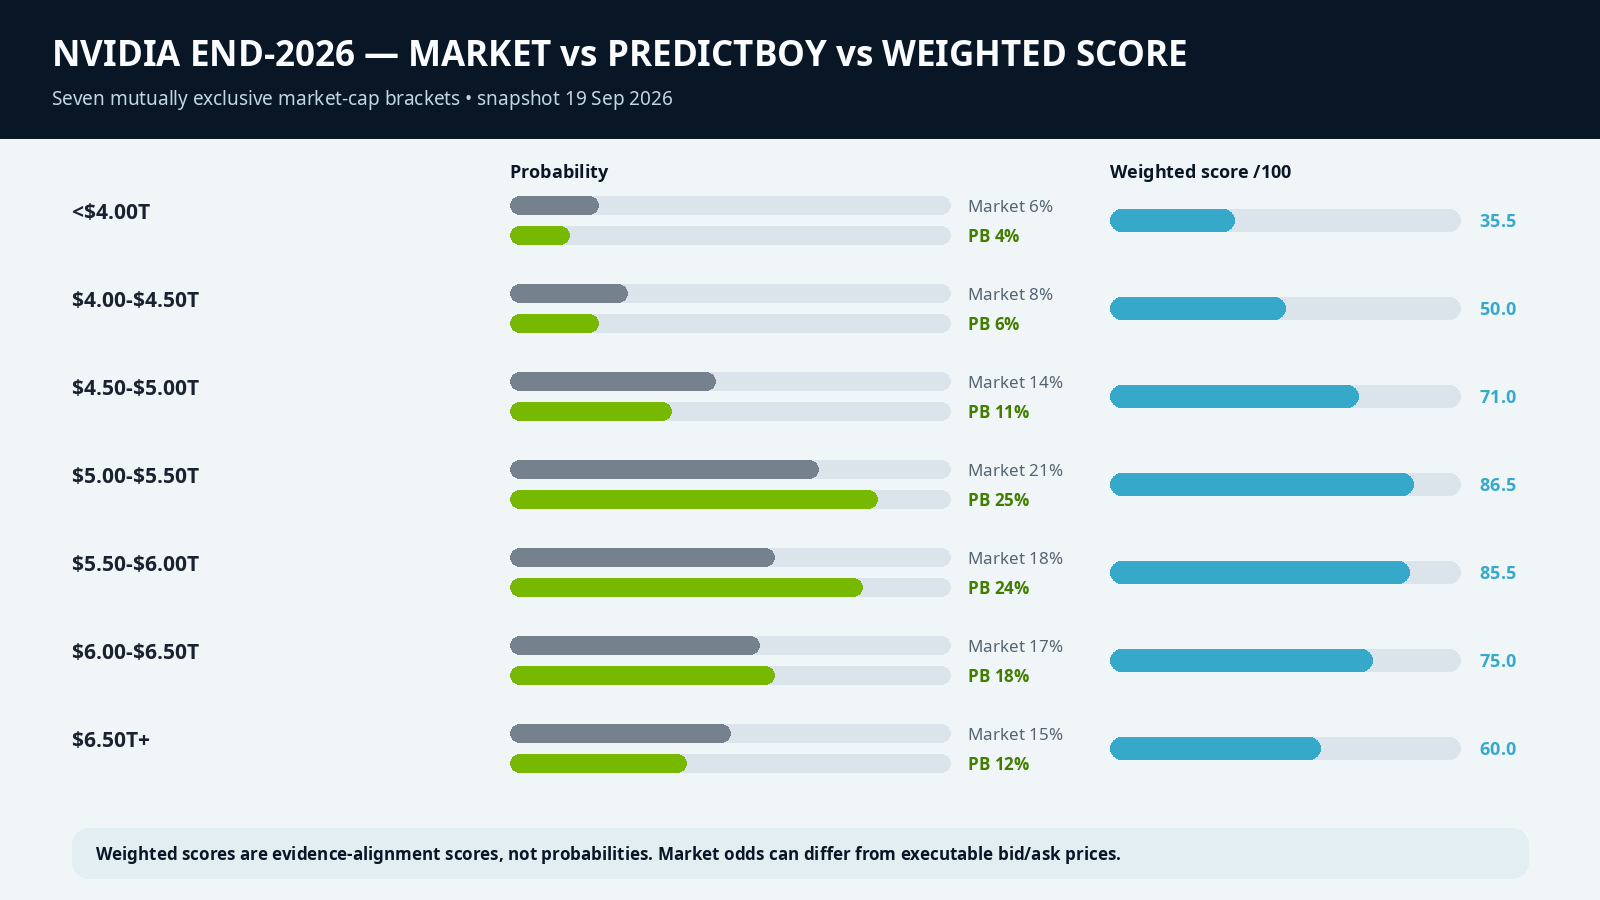
I score each bracket on six factors from 1 to 10, then apply weights totaling 100%. The scores are an analytical framework rather than calibrated probabilities and are intentionally not tuned to reproduce Polymarket prices.
| Factor | Weight | Outcome scores | Key evidence | Impact |
|---|---|---|---|---|
| Starting valuation & bin distance | 25% | <$4.00T 3/10; $4.00-$4.50T 4/10; $4.50-$5.00T 7/10; $5.00-$5.50T 10/10; $5.50-$6.00T 9/10; $6.00-$6.50T 7/10; $6.50T+ 5/10 | Polymarket context places Nvidia near $5.3T; distance to each bracket matters directly. | High |
| AI demand & revenue momentum | 25% | <$4.00T 2/10; $4.00-$4.50T 4/10; $4.50-$5.00T 6/10; $5.00-$5.50T 8/10; $5.50-$6.00T 9/10; $6.00-$6.50T 9/10; $6.50T+ 8/10 | Q2 FY27 revenue $96.2B and Data Center $89.0B; Q3 guide $108B ±2%. | High |
| Blackwell/Rubin execution | 20% | <$4.00T 2/10; $4.00-$4.50T 4/10; $4.50-$5.00T 6/10; $5.00-$5.50T 8/10; $5.50-$6.00T 9/10; $6.00-$6.50T 9/10; $6.50T+ 8/10 | Blackwell Ultra drives current growth; Vera Rubin is in full production and shipping/ramping with major clouds. | High |
| Valuation multiple & macro | 15% | <$4.00T 6/10; $4.00-$4.50T 7/10; $4.50-$5.00T 9/10; $5.00-$5.50T 9/10; $5.50-$6.00T 8/10; $6.00-$6.50T 6/10; $6.50T+ 4/10 | High rates, inflation and broader AI-risk sentiment can expand or compress the equity multiple quickly. | Medium-high |
| Competition & China/export risk | 10% | <$4.00T 7/10; $4.00-$4.50T 8/10; $4.50-$5.00T 9/10; $5.00-$5.50T 8/10; $5.50-$6.00T 7/10; $6.00-$6.50T 5/10; $6.50T+ 3/10 | China data-center compute remains constrained while AMD, custom silicon and Huawei compete for workloads. | Medium |
| Share-count mechanics | 5% | <$4.00T 6/10; $4.00-$4.50T 7/10; $4.50-$5.00T 8/10; $5.00-$5.50T 8/10; $5.50-$6.00T 7/10; $6.00-$6.50T 6/10; $6.50T+ 5/10 | Resolution uses total shares outstanding; buybacks lower the share count while equity issuance can offset that. | Secondary |
The resulting evidence-fit totals are:
| Bracket | Weighted score | PredictBoy probability |
|---|---|---|
| <$4.00T | 35.5/100 | 4% |
| $4.00-$4.50T | 50.0/100 | 6% |
| $4.50-$5.00T | 71.0/100 | 11% |
| $5.00-$5.50T | 86.5/100 | 25% |
| $5.50-$6.00T | 85.5/100 | 24% |
| $6.00-$6.50T | 75.0/100 | 18% |
| $6.50T+ | 60.0/100 | 12% |
The framework narrowly favors $5.0–$5.5T at 86.5/100, followed closely by $5.5–$6.0T at 85.5/100. The gap is small because Nvidia’s fundamentals support upside, while the starting valuation and macro multiple risk make the more aggressive brackets increasingly demanding.
Nvidia Earnings, AI Demand and Valuation Evidence
Revenue growth remains extraordinary
Nvidia’s Q2 FY2027 revenue was $96.2B, up 106% year over year and 18% sequentially. Data Center revenue was $89.0B, up 117% year over year, while gross margin was 75.0%. Management guided Q3 revenue to $108.0B ±2% and gross margin to 74.0% ±50 basis points.
Rubin is no longer only a roadmap story
Nvidia says Vera Rubin is in full production, with racks running at partners including CoreWeave, Google Cloud, Microsoft Azure, Oracle Cloud Infrastructure and Nebius. That matters because the market-cap question extends only a few months: execution already underway can influence year-end expectations more directly than products still years away.
Supply and infrastructure commitments show both demand and risk
Nvidia’s SEC filing says supply and capacity commitments rose from $119B in the prior quarter to $279B as of July 26, 2026. The same filing warns that power, land, shell, financing and customer deployment constraints can delay revenue. Large commitments are therefore evidence of confidence in demand, but also increase execution and counterparty exposure.
China remains a structural constraint
The 10-Q says shipments of Data Center Hopper products to China were less than 1% of Data Center revenue in the latest quarter and that Nvidia was effectively foreclosed from competing broadly in China’s data-center compute market under the current export-control environment. That reduces a large addressable market and gives local competitors room to build ecosystems.
What the Market May Be Underestimating
The market may be underestimating the mechanical effect of share count. Nvidia has an unusually large repurchase program: the company repurchased about 94M shares in Q2 and had roughly $99B of authorization remaining. Because Polymarket resolves on price multiplied by shares outstanding, lower shares can slightly reduce the market-cap number at the same stock price even if the buyback is supportive for EPS and price.
On the upside, the market may be underestimating how quickly very large revenue growth can translate into forward-earnings revisions when margins stay near the mid-70s. On the downside, it may be underestimating how sensitive a multi-trillion-dollar growth stock is to discount rates and to any broad AI-capex slowdown.
Bull and Bear Cases for the Major Outcomes
| Scenario | What would support it | What would undermine it |
|---|---|---|
| $5.0–$5.5T | Strong growth continues but valuation stays near today’s broad level. | Either sharp multiple compression or a renewed upside re-rating. |
| $5.5–$6.0T | Rubin execution, Q3/Q4 earnings revisions and resilient AI capex. | High yields, capex caution, competition or deployment delays. |
| $6.0T+ | Exceptional revenue/earnings revisions plus sustained or higher valuation multiple. | Any macro de-rating or evidence that AI infrastructure growth is normalizing. |
| <$5.0T | Valuation compression, macro stress, weaker AI spend or competitive/export shocks. | Continued earnings upside and strong demand visibility. |
Risks and Uncertainties
- Market liquidity: Polymarket event volume is relatively small, so displayed probabilities can move sharply.
- Interest-rate risk: higher long yields can compress equity multiples even with strong operating performance.
- AI spending risk: hyperscaler or frontier-lab capex plans can change quickly.
- Competition: AMD, custom accelerators and Chinese alternatives can alter expectations about long-run share and margins.
- Export controls and geopolitics: Nvidia’s China opportunity remains constrained and further rules are possible.
- Supply / power / financing: customer deployments can be delayed even when end-demand exists.
- Share-count drift: buybacks, compensation and other issuance change the denominator used in the market-cap calculation.
PredictBoy Probability Assessment
PredictBoy analysis, not fact: my distribution is <$4.0T 4%, $4.0–$4.5T 6%, $4.5–$5.0T 11%, $5.0–$5.5T 25%, $5.5–$6.0T 24%, $6.0–$6.5T 18%, and $6.5T+ 12%. I put 49% across the two $5.0–$6.0T brackets because the operating momentum is extraordinary but the starting valuation and macro environment leave limited room for execution mistakes.
Market Odds vs. PredictBoy
| Bracket | Polymarket | PredictBoy | Difference |
|---|---|---|---|
| <$4.00T | 6% | 4% | -2 pp |
| $4.00-$4.50T | 8% | 6% | -2 pp |
| $4.50-$5.00T | 14% | 11% | -3 pp |
| $5.00-$5.50T | 21% | 25% | +4 pp |
| $5.50-$6.00T | 18% | 24% | +6 pp |
| $6.00-$6.50T | 17% | 18% | +1 pp |
| $6.50T+ | 15% | 12% | -3 pp |
My distribution is more concentrated in the $5.0–$6.0T middle than the market and assigns slightly less probability to the extreme upside and downside tails. The disagreement is modest: both views imply a wide range because Nvidia’s growth rate and valuation sensitivity are both unusually high.
What Could Change Before Resolution
- Q3 FY2027 results: whether revenue lands around or above the $108B guide, and how Rubin affects forward guidance.
- Rubin production and cloud deployment: evidence of smooth scale-up versus bottlenecks.
- Hyperscaler / AI-lab capex: any acceleration or slowdown in 2027 infrastructure budgets.
- Rates and inflation: the discount rate applied to high-growth technology equities.
- China/export policy: any reopening or tightening of Nvidia’s addressable market.
- Share repurchases: the year-end share count used in Polymarket’s resolution formula.
Final Take
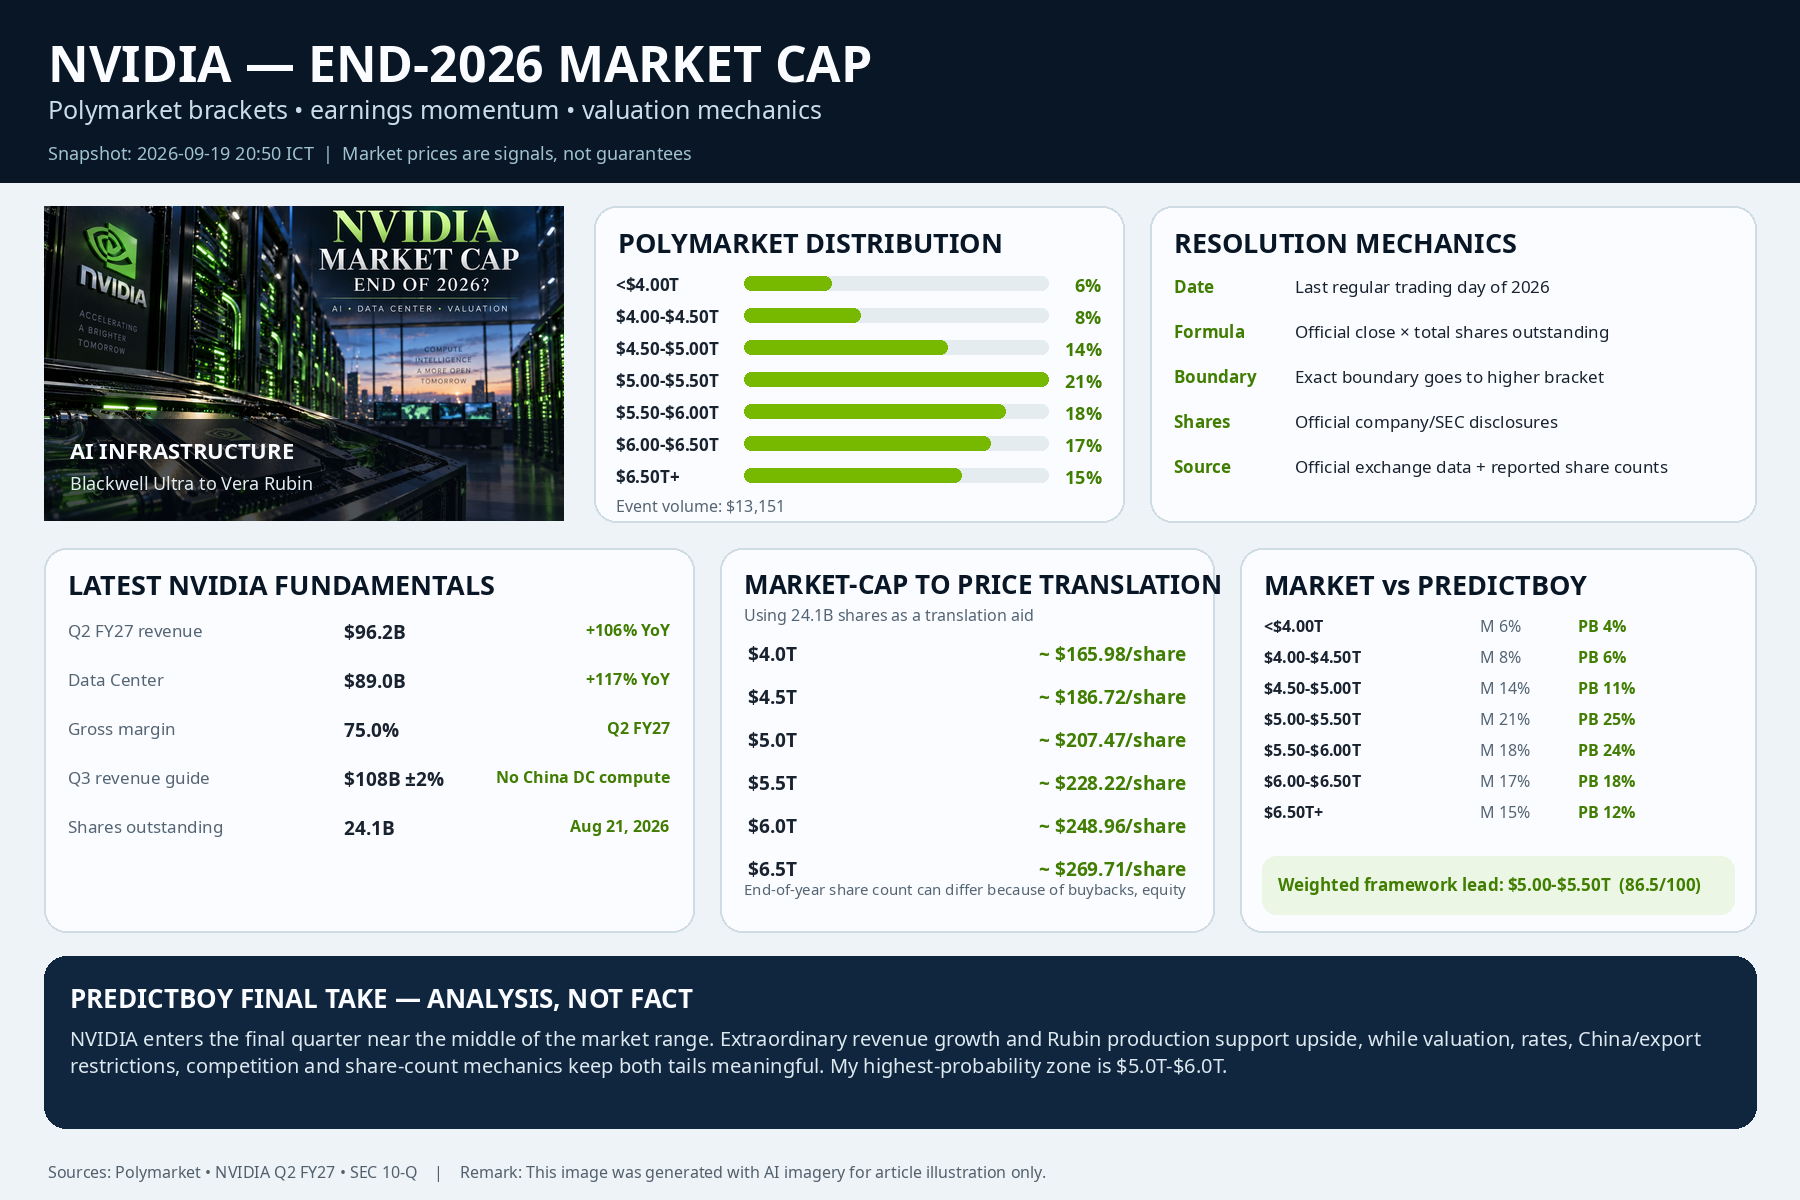
PredictBoy analysis: Nvidia’s fundamentals justify treating the $5T–$6T zone as the center of the distribution, not because growth is ordinary but because the company already starts from an extraordinary valuation. Q2 results, Q3 guidance and Rubin production keep the upside case strong; the limiting variables are valuation multiple, macro rates, China/competition risk and execution across an enormous infrastructure buildout. The market’s broad bracket spread is therefore reasonable, even if I place slightly more weight in the middle than Polymarket does.
Sources
- Polymarket — Nvidia’s Market Cap end of 2026?
- NVIDIA / SEC — Q2 FY2027 earnings release and Q3 outlook
- NVIDIA Form 10-Q for quarter ended July 26, 2026
- NVIDIA Newsroom — Rubin platform and deployment ecosystem
- Reuters reporting, September 2026, on AI spending concerns, semiconductor-market volatility and Nvidia-linked infrastructure demand.
Disclosure: Prediction-market prices are volatile and are not guaranteed real-world probabilities. This article is for analytical and informational purposes and is not financial advice.