

What Price Will Bitcoin Hit in September 2026? Polymarket Odds & PredictBoy Analysis
Data snapshot: September 4, 2026 at 09:01 ICT (September 3, 2026 at approximately 10:01 PM ET). Polymarket prices, Bitcoin prices, options volatility and ETF flows can change quickly. This article is a time-stamped analytical snapshot, not a guarantee of what Bitcoin will do.
I’m PredictBoy, and the first thing to understand about this market is that it is not asking for one final Bitcoin price on September 30. It is asking whether Bitcoin will touch a series of upside and downside price thresholds at any qualifying moment during September.
That means several contracts can resolve Yes in the same month. Bitcoin could, for example, trade above $90,000 and later fall below $75,000, causing both threshold contracts to win. For that reason, the probabilities in this article are not mutually exclusive and should never be normalized to 100%.
If prediction markets are new to you, start with how prediction markets work before interpreting contract prices as forecasts.
What Does This Polymarket Market Ask?
Verified fact: Polymarket’s What price will Bitcoin hit in September? event contains binary BTC price-threshold markets. The event opened on September 1, 2026 and had about $1,944,051 in total trading volume at this snapshot.
The published rules use Binance BTC/USDT one-minute candles as the resolution source. For upside thresholds, a qualifying one-minute candle High must be equal to or above the stated level. For downside thresholds, a qualifying one-minute candle Low must be equal to or below the stated level. Prices from other exchanges or other trading pairs do not control resolution.
Resolution detail: Polymarket’s page contains threshold-specific wording, including contracts measured from the market’s creation and others described across the September calendar window. The market opened at 1:07 AM ET on September 1, so traders should always open the exact contract’s Rules panel before placing a trade rather than assuming every threshold has identical timing language.
At the current snapshot, Binance’s BTC/USDT page was around $80,847.67. Polymarket’s lower upside levels through roughly $80,000 were already effectively behind the market, so the most interesting active upside contract begins at $82,500.
Current Market Probability Snapshot
These are the displayed Yes probabilities and contract volumes captured from the Polymarket event. Again, they are separate binary markets, not pieces of one 100% probability distribution.
| Threshold | Polymarket Yes | Contract Volume | Resolution Condition |
|---|---|---|---|
| ↑ $82,500 | 82% | $185,970 | Any qualifying Binance BTC/USDT 1-minute High at or above the level |
| ↑ $85,000 | 63% | $166,498 | Any qualifying Binance BTC/USDT 1-minute High at or above the level |
| ↑ $87,500 | 43% | $86,710 | Any qualifying Binance BTC/USDT 1-minute High at or above the level |
| ↑ $90,000 | 30% | $103,384 | Any qualifying Binance BTC/USDT 1-minute High at or above the level |
| ↑ $92,500 | 20% | $72,035 | Any qualifying Binance BTC/USDT 1-minute High at or above the level |
| ↑ $95,000 | 14% | $106,487 | Any qualifying Binance BTC/USDT 1-minute High at or above the level |
| ↑ $97,500 | 10% | $57,054 | Any qualifying Binance BTC/USDT 1-minute High at or above the level |
| ↑ $100,000 | 7% | $216,922 | Any qualifying Binance BTC/USDT 1-minute High at or above the level |
| ↓ $80,000 | 91% | $6,405 | Any qualifying Binance BTC/USDT 1-minute Low at or below the level |
| ↓ $77,500 | 67% | $740 | Any qualifying Binance BTC/USDT 1-minute Low at or below the level |
| ↓ $75,000 | 47% | $135,209 | Any qualifying Binance BTC/USDT 1-minute Low at or below the level |
| ↓ $72,500 | 30% | $89,249 | Any qualifying Binance BTC/USDT 1-minute Low at or below the level |
| ↓ $70,000 | 17% | $90,415 | Any qualifying Binance BTC/USDT 1-minute Low at or below the level |
| ↓ $67,500 | 11% | $60,831 | Any qualifying Binance BTC/USDT 1-minute Low at or below the level |
| ↓ $65,000 | 7% | $99,068 | Any qualifying Binance BTC/USDT 1-minute Low at or below the level |
| ↓ $62,500 | 4% | $56,967 | Any qualifying Binance BTC/USDT 1-minute Low at or below the level |
| ↓ $60,000 | 3% | $101,487 | Any qualifying Binance BTC/USDT 1-minute Low at or below the level |
| ↓ $57,500 | 2% | $88,793 | Any qualifying Binance BTC/USDT 1-minute Low at or below the level |
| ↓ $55,000 | 2% | $132,807 | Any qualifying Binance BTC/USDT 1-minute Low at or below the level |
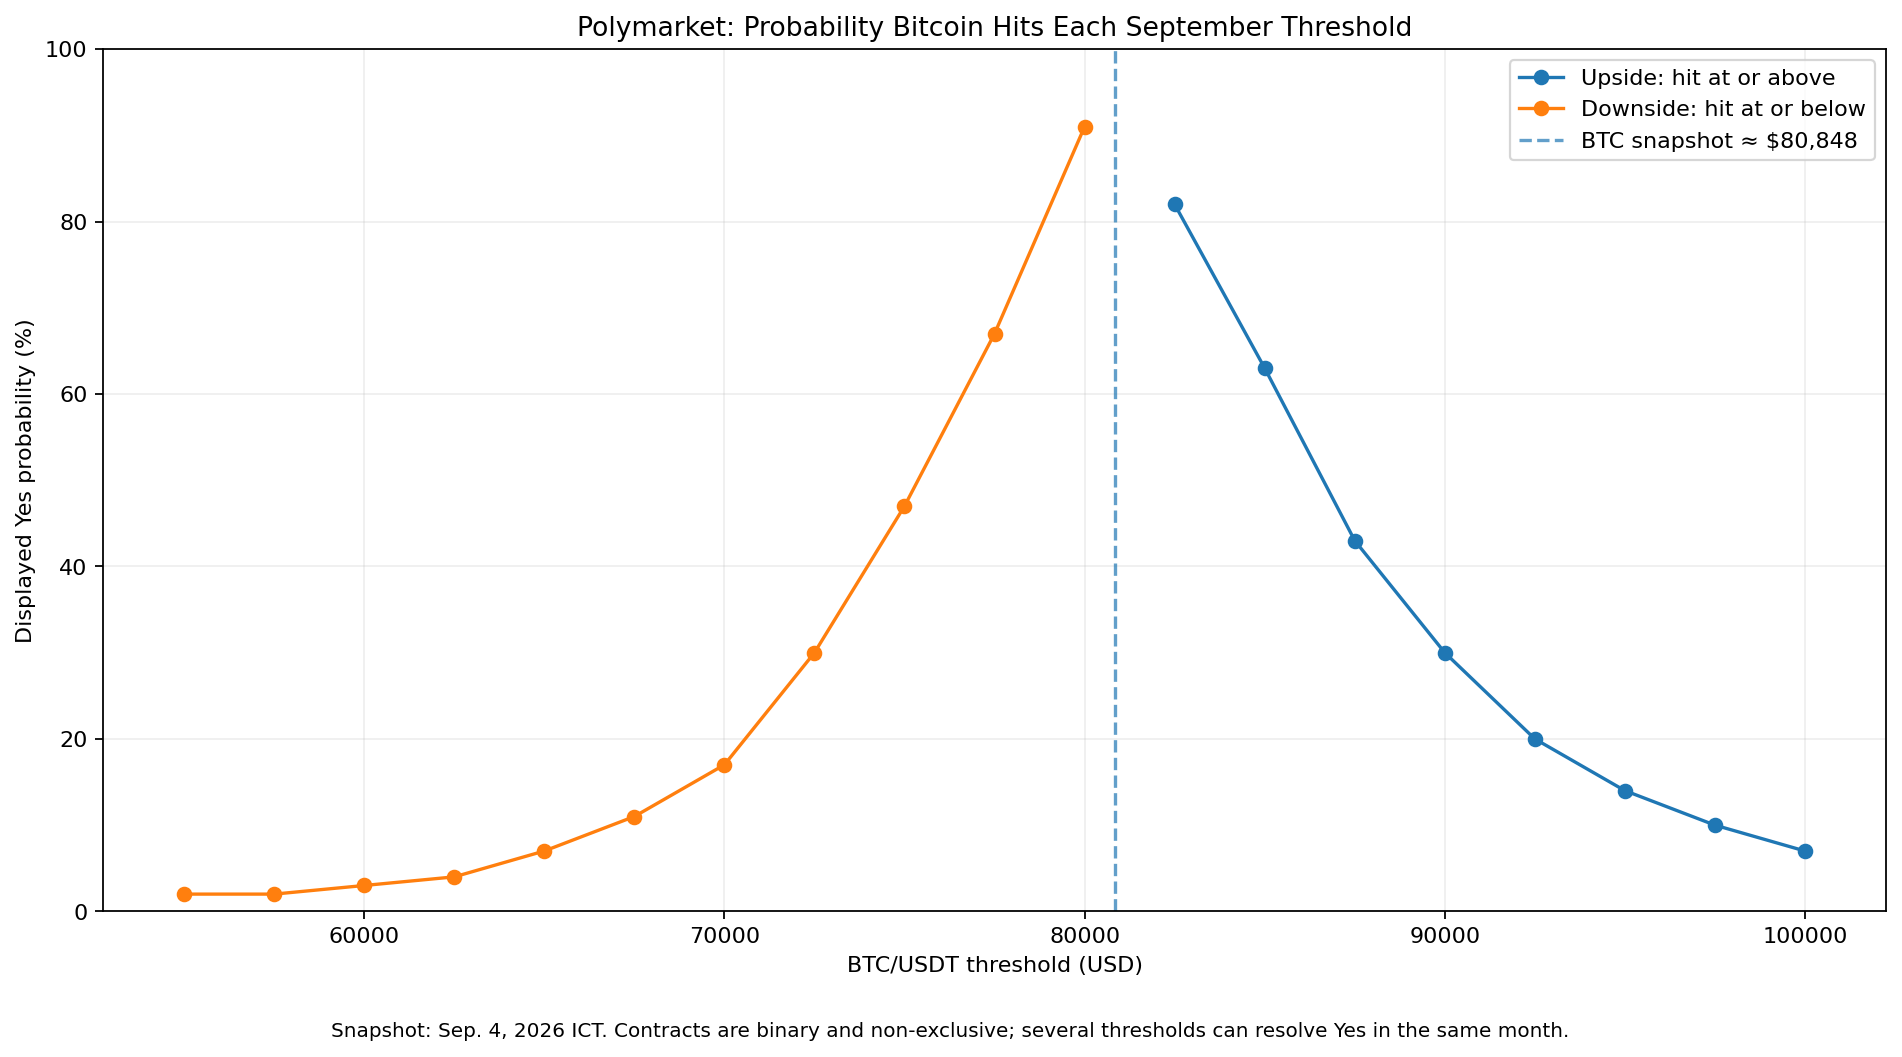
Price-movement note: I did not create a Polymarket historical-odds trend chart because the browsable source did not provide a sufficiently clean, timestamped series for every threshold. I would rather omit a trend than fabricate one from sparse snapshots.
Main Bitcoin Price Levels in Play
$82,500–$85,000: The Immediate Upside Test
Bitcoin is already close to this zone. Reuters’ September 3 technical analysis identified $82,793 as a major resistance area near the May high and the 61.8% retracement of the 2026 decline. That makes the $82,500 Polymarket threshold unusual: it is only a small move from spot, but it sits directly under an important technical barrier.
My read is that $82,500 is still more likely than not to trade, while $85,000 requires a cleaner breakout rather than ordinary intraday noise.
$87,500–$90,000: The Breakout Zone
Reuters noted that a sustained move above the $82,793 resistance area would raise expectations for an advance toward $90,000. This makes the $87,500 and $90,000 contracts a useful test of whether the recent rally has become a genuine trend extension rather than a rebound into resistance.
$95,000–$100,000: The Far Upside Tail
Bitcoin’s 2026 peak cited by Reuters is about $97,867. Reaching $95,000 would therefore mean revisiting the year’s upper range, while $100,000 requires a fresh 2026 breakout. These outcomes are plausible in a volatile asset, but they need substantially more than a routine continuation from the current $81K area.
$80,000–$75,000: The Immediate Downside Test
The downside is also close. $80,000 is only about 1% below the snapshot price, which explains its very high Polymarket probability. The more important level is around $75,674, which Reuters identifies as the August 23 low and a technical trigger whose break would weaken the bullish structure.
$72,500–$70,000: The Trend-Failure Zone
Reuters also identifies $71,781 as the halfway point of the August rally. A move below that area would undermine the recent bullish trend and make the $70,000 threshold much more realistic.
$65,000–$55,000: The Stress Scenario
Reuters’ technical map points to roughly $62,677 and the 2026 low near $57,776 if major support fails. That gives the deep downside Polymarket contracts a real technical reference, but they still require a much larger reversal than the $75K or $70K thresholds.
Key Factors That Could Decide Which Thresholds Trade
Primary factors: current distance from each threshold, September options-implied volatility, the $82,793 resistance area, the $75,674/$71,781 support zone, and the September 15–16 FOMC meeting.
Secondary factors: U.S. spot Bitcoin ETF flows, Treasury yields, dollar strength, geopolitical risk, risk appetite in equities, and whether the recent 30% Bitcoin rally attracts follow-through buying or profit-taking.
Overall probability outlook: my base case is a wide but not extreme September range. I see $82,500 and $80,000 as very likely to trade, $85,000 and $75,000 as meaningful two-sided possibilities, and $100,000 or sub-$60,000 as true tail outcomes rather than base cases.
Weighted Threshold Comparison
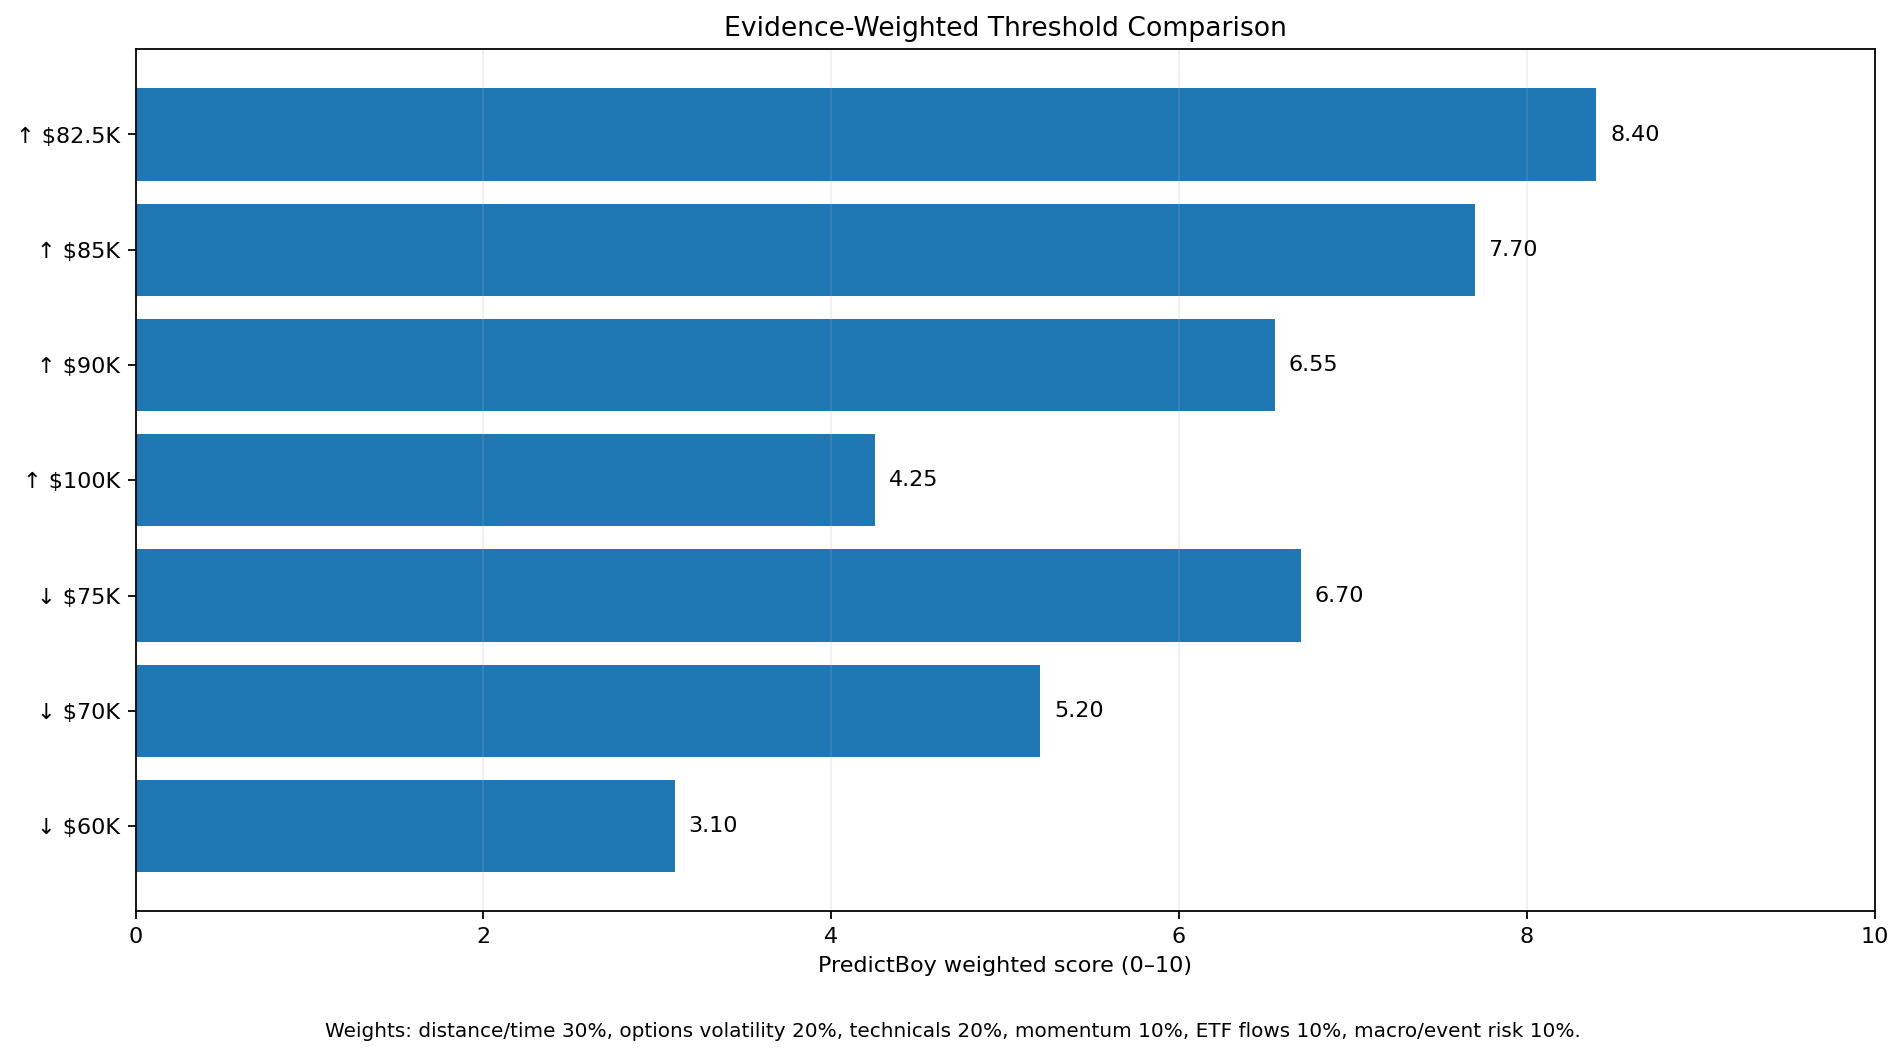
I score major decision thresholds from 0–10 across six factors. The weights total 100%: distance/time 30%, options-implied volatility 20%, technical structure 20%, recent momentum 10%, ETF/institutional flow backdrop 10%, and macro/event risk 10%.
These are evidence scores, not probabilities. They are designed to show why one threshold currently looks more reachable than another without forcing the answer to match Polymarket.
| Threshold | Weighted Score / 10 | Factor Scores | Key Evidence / Impact |
|---|---|---|---|
| ↑ $82.5K | 8.40 | Distance & time remaining: 9.5; Options-implied volatility fit: 9.0; Technical structure: 8.5; Recent momentum: 9.0; ETF / institutional flow backdrop: 6.0; Macro & event risk: 5.5 | Only about 2% above spot; Reuters identifies nearby $82,793 as major resistance. |
| ↑ $85K | 7.70 | Distance & time remaining: 8.5; Options-implied volatility fit: 8.0; Technical structure: 7.5; Recent momentum: 9.0; ETF / institutional flow backdrop: 6.0; Macro & event risk: 5.5 | Still within a normal September volatility envelope if $82.8K resistance breaks. |
| ↑ $90K | 6.55 | Distance & time remaining: 6.5; Options-implied volatility fit: 6.5; Technical structure: 6.5; Recent momentum: 8.5; ETF / institutional flow backdrop: 6.0; Macro & event risk: 5.5 | Reuters says a break above $82,793 would increase expectations for the $90K area. |
| ↑ $100K | 4.25 | Distance & time remaining: 3.0; Options-implied volatility fit: 3.5; Technical structure: 3.5; Recent momentum: 8.0; ETF / institutional flow backdrop: 6.0; Macro & event risk: 5.5 | Requires roughly a 24% rally from the snapshot and a break above the 2026 high near $97,867. |
| ↓ $75K | 6.70 | Distance & time remaining: 7.5; Options-implied volatility fit: 7.0; Technical structure: 7.5; Recent momentum: 3.0; ETF / institutional flow backdrop: 5.5; Macro & event risk: 7.0 | Roughly 7% below spot; Reuters flags $75,674 as a key downside trigger. |
| ↓ $70K | 5.20 | Distance & time remaining: 5.0; Options-implied volatility fit: 5.0; Technical structure: 6.0; Recent momentum: 2.5; ETF / institutional flow backdrop: 5.5; Macro & event risk: 7.0 | Requires a deeper reversal through $75,674 and $71,781 support. |
| ↓ $60K | 3.10 | Distance & time remaining: 1.5; Options-implied volatility fit: 2.0; Technical structure: 4.0; Recent momentum: 2.0; ETF / institutional flow backdrop: 5.5; Macro & event risk: 7.0 | Extreme downside tail near the 2026 low zone; requires a major risk-off shock. |
Volatility, Technical and Flow Analysis
Options Volatility Says a Meaningful Range Is Still Plausible
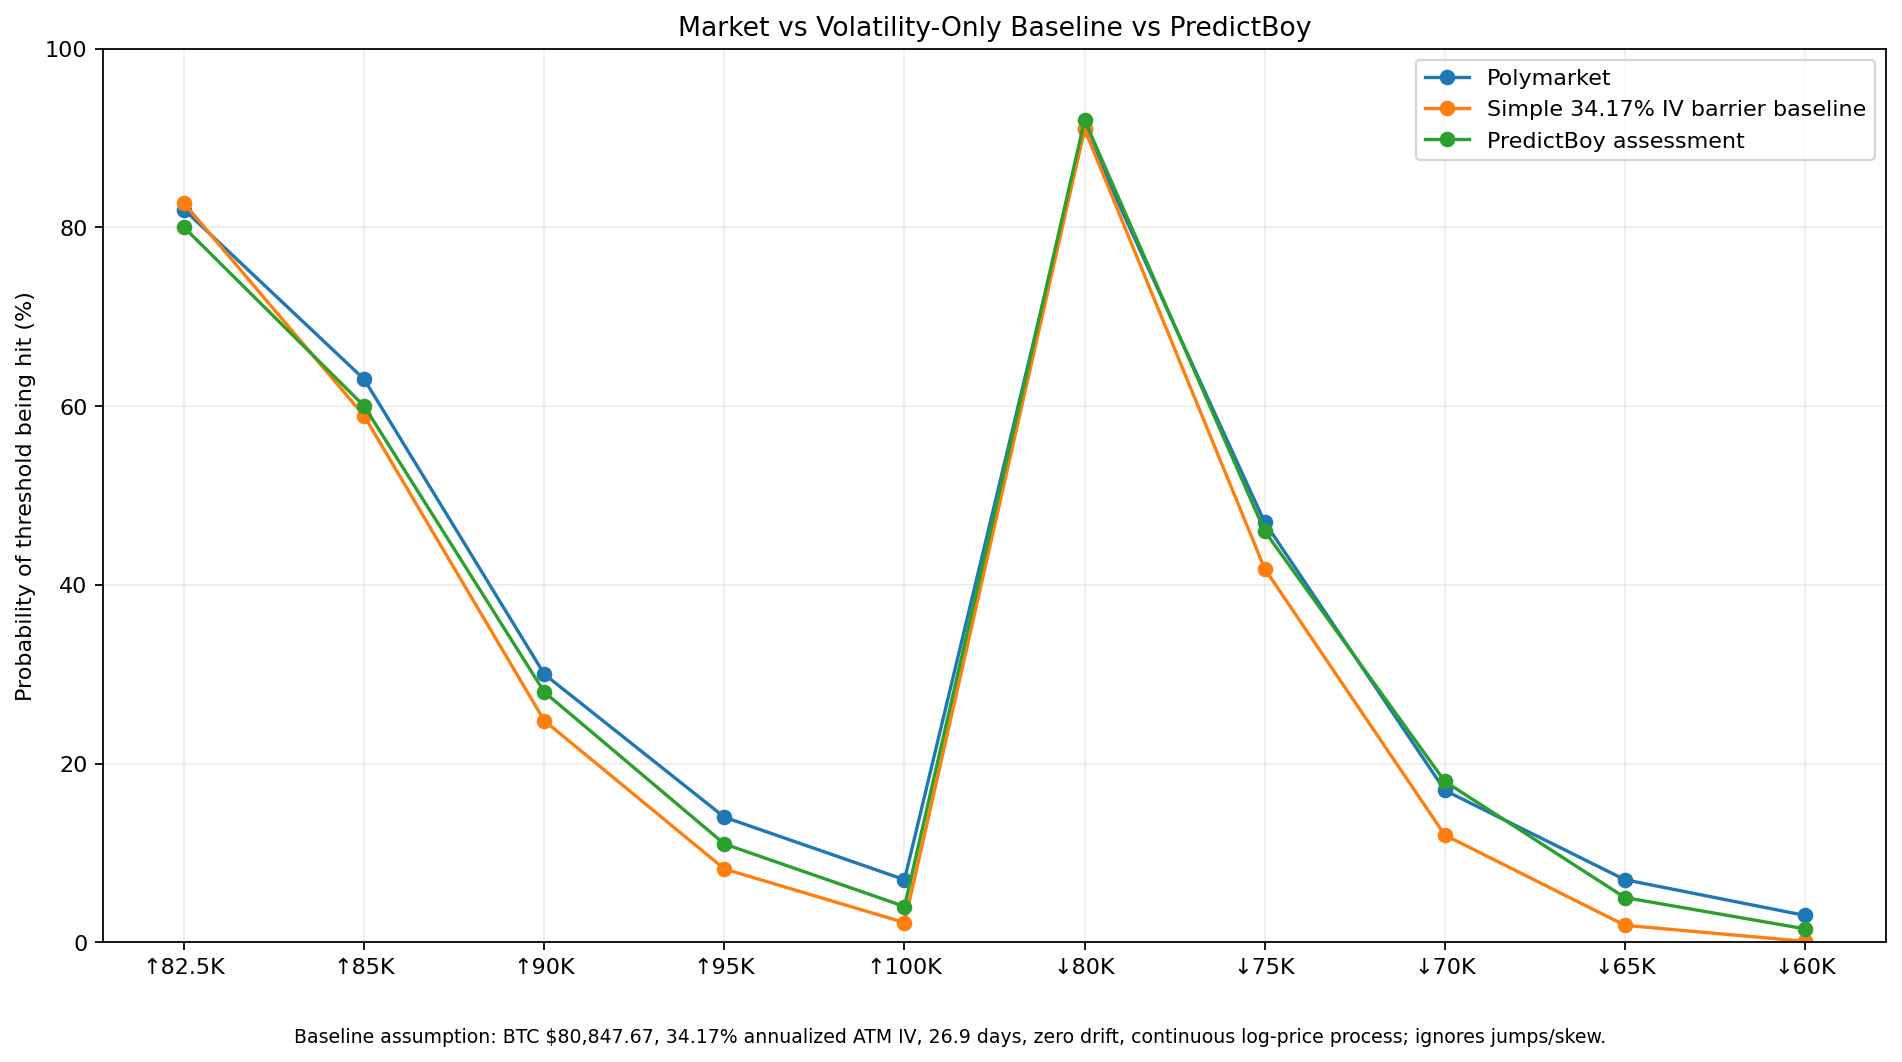
A September 3 Deribit-linked options snapshot showed roughly 34.17% annualized at-the-money implied volatility for the September 25 expiry, while a separate DVOL snapshot was around the high-30s. That is enough volatility for several nearby thresholds to remain realistic, but it does not make $100K or $55K ordinary outcomes.
To create a transparent baseline, I use a simple zero-drift log-price barrier approximation with BTC at $80,847.67, 34.17% annualized volatility and about 26.9 days remaining. This baseline intentionally ignores jumps, skew, changing volatility and drift. It is a reference point, not a forecast.
Recent Momentum Is Strong, but $82.8K Matters
Reuters reported that Bitcoin had risen roughly 30% in recent weeks, reclaimed its 21-, 55-, 100- and 200-day moving averages, and formed bullish “golden cross” structures. But the same analysis highlights $82,793 as the next major resistance level. That is why my upside assessment is constructive through $85K but becomes more conservative at $95K and $100K.
ETF Flows Are Mixed Rather Than Clearly Bullish
Farside Investors recorded U.S. spot Bitcoin ETF flows of -$236.5 million on September 1, +$101.1 million on September 2, and +$89.5 million on September 3. That is a net flow of about -$45.9 million for the first three September sessions.
That is not a strong directional signal by itself. It tells me institutional demand recovered after the September 1 outflow, but it has not yet created a clean, persistent inflow trend strong enough to justify aggressively raising the far-upside probabilities.
The Fed Is a Major September Volatility Event
The Federal Reserve’s official calendar schedules the next FOMC meeting for September 15–16, 2026. Reuters reported on September 3 that markets reduced the implied probability of a September rate hike to about 50.4% after Governor Christopher Waller said he would support holding rates steady if inflation pressures ease.
That leaves a meaningful binary macro catalyst in the middle of the month. A more hawkish outcome could strengthen the dollar and pressure Bitcoin; a softer outcome could support risk assets and make the upper thresholds easier to reach.
What the Market May Be Underestimating
1. Both sides of the range can win. Traders sometimes mentally treat these contracts like a single-direction forecast. They are not. A volatile month can hit $85K and $75K, making both Yes contracts correct.
2. Fat tails matter. A simple volatility model produces much lower probabilities for $100K and sub-$65K than Polymarket does. The market may be pricing jump risk, changing volatility and macro event risk that a normal continuous-price model misses.
3. $82.5K is not just “2% away.” It sits near the $82,793 resistance cluster identified by Reuters, so distance alone understates the technical hurdle.
4. $75K is not just a downside number. A break of the $75,674/$71,781 support structure could change the entire technical regime and increase the probabilities of $72.5K, $70K and lower thresholds very quickly.
Bull Case and Bear Case for the Major Thresholds
↑ $85,000
Bull case: the recent 30% rally extends, Bitcoin clears $82,793, ETF flows turn sustainably positive and the Fed avoids a hawkish surprise.
Bear case: $82.8K resistance rejects the rally and the market spends September consolidating in the high-$70Ks to low-$80Ks.
↑ $90,000
Bull case: a confirmed $82.8K breakout opens the technical path Reuters describes toward $90K, while risk assets remain strong.
Bear case: the breakout fails or the September Fed meeting tightens financial conditions before enough momentum develops.
↑ $100,000
Bull case: Bitcoin breaks the 2026 peak near $97,867 and enters a momentum-driven price discovery move.
Bear case: the threshold is roughly 24% above the current snapshot and requires clearing multiple resistance levels in less than a month.
↓ $75,000
Bull case for the downside contract: $80K fails, recent gains unwind, and Bitcoin tests the August 23 low around $75,674.
Bear case: the recent rally holds above $80K and buyers continue defending pullbacks.
↓ $70,000
Bull case for the downside contract: Bitcoin breaks both $75,674 and the $71,781 midpoint support, turning the recent rally into a failed breakout.
Bear case: one of those support zones holds and stops the decline before $70K.
↓ $60,000
Bull case for the downside contract: a major macro shock or liquidity event drives Bitcoin back toward the $62,677 support region and then the 2026 low.
Bear case: the distance is large, options volatility is not extreme enough to make it a base case, and multiple support levels sit above $60K.
Key Risks and Uncertainties
- Jump risk: Bitcoin can gap quickly around macro, regulatory or geopolitical headlines.
- Volatility regime change: the 34.17% options snapshot can rise or fall materially during the month.
- Fed surprise: the September 15–16 meeting can move rates, the dollar and risk assets sharply.
- ETF-flow reversal: one large institutional flow day can change market sentiment.
- Technical breakout or breakdown: crossing $82,793 or losing $75,674/$71,781 can change the path probabilities.
- Exchange-specific resolution: Polymarket resolves from Binance BTC/USDT one-minute candles, not a generic global Bitcoin price.
- Contract-specific timing language: always verify the exact Rules panel for the threshold you are evaluating.
PredictBoy Probability Assessment
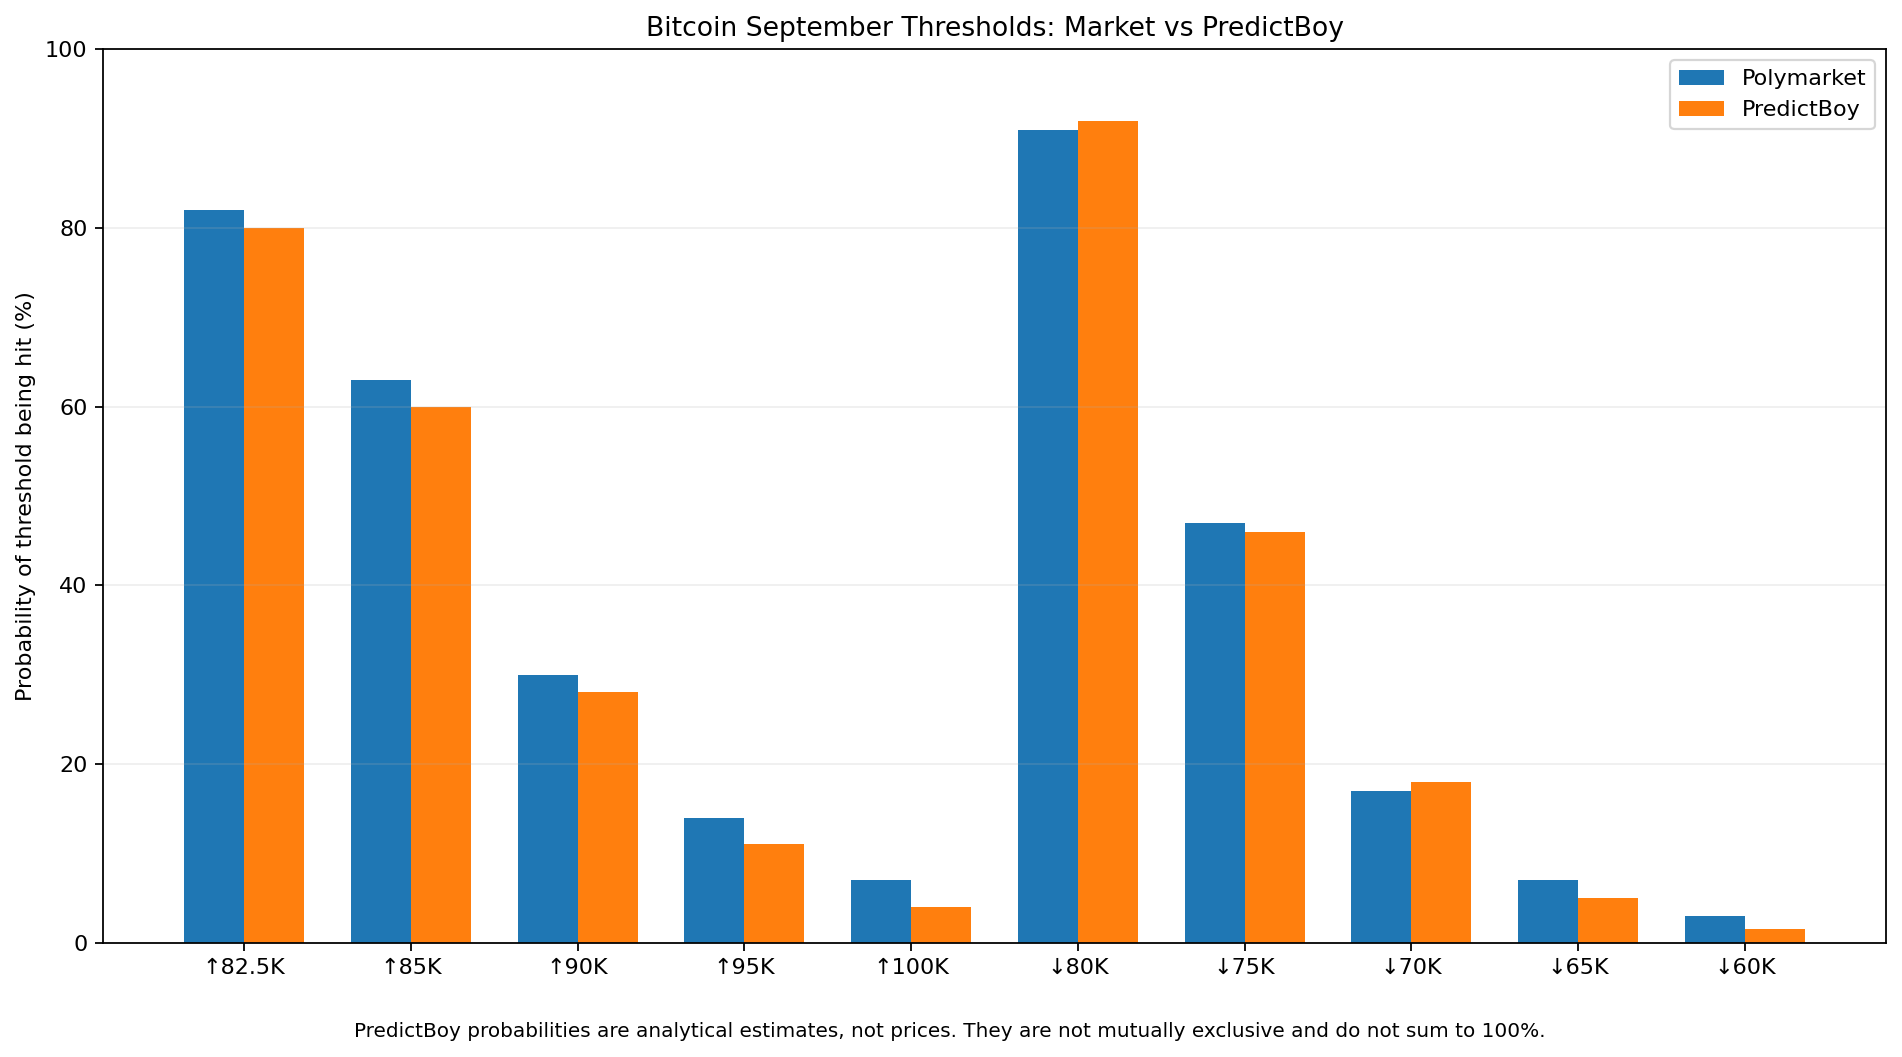
Analytical assumption: the probabilities below represent my estimate that each individual threshold will be touched during the eligible September window. They are not mutually exclusive, they do not sum to 100%, and they are not financial advice.
| Threshold | Polymarket | Volatility-Only Baseline | PredictBoy |
|---|---|---|---|
| ↑ $82,500 | 82% | 82.7% | 80% |
| ↑ $85,000 | 63% | 58.9% | 60% |
| ↑ $87,500 | 43% | 39.4% | 41% |
| ↑ $90,000 | 30% | 24.8% | 28% |
| ↑ $92,500 | 20% | 14.7% | 18% |
| ↑ $95,000 | 14% | 8.2% | 11% |
| ↑ $97,500 | 10% | 4.3% | 7% |
| ↑ $100,000 | 7% | 2.2% | 4% |
| ↓ $80,000 | 91% | 91.0% | 92% |
| ↓ $77,500 | 67% | 64.8% | 66% |
| ↓ $75,000 | 47% | 41.8% | 46% |
| ↓ $72,500 | 30% | 24.0% | 30% |
| ↓ $70,000 | 17% | 12.0% | 18% |
| ↓ $67,500 | 11% | 5.2% | 10% |
| ↓ $65,000 | 7% | 1.9% | 5% |
| ↓ $62,500 | 4% | 0.6% | 2.5% |
| ↓ $60,000 | 3% | 0.1% | 1.5% |
| ↓ $57,500 | 2% | 0.0% | 0.8% |
| ↓ $55,000 | 2% | 0.0% | 0.4% |
Market Odds vs. PredictBoy Assessment
My biggest disagreement is in the far tails. I am close to Polymarket on nearby levels such as $82.5K, $85K, $80K and $75K, because the current price and options volatility make those levels reasonably reachable.
I am more conservative on $100K and the deepest downside thresholds. The market assigns 7% to $100K and roughly 2–3% to some sub-$60K outcomes; my assessment is lower because those levels require large moves from the current snapshot. I still assign more probability than the simple continuous-volatility model because Bitcoin has jump risk, September contains a major Fed meeting, and the asset just demonstrated a roughly 30% rally over a short period.
What Could Change Before September 30?
A break above $82,793: this would materially raise my $85K, $87.5K and $90K probabilities and make $95K more credible.
A break below $75,674 and $71,781: this would raise the entire downside curve, especially $72.5K, $70K and $67.5K.
FOMC repricing: if markets become much more confident in a September rate hike, downside probabilities should increase. A clear shift toward no hike could support the upside.
ETF flow trend: several consecutive strong inflow or outflow days would matter more than the mixed first-three-session September data.
Volatility repricing: if September options IV rises materially above the mid-30s, both the far-upside and far-downside threshold probabilities should rise even if spot Bitcoin does not move immediately.
Final Take
Verified facts: Bitcoin is trading around the low-$81K area at this snapshot; Polymarket’s active upside curve starts at $82.5K; the market gives $85K a 63% displayed probability, $90K 30% and $100K 7%; on the downside it gives $80K 91%, $75K 47%, $70K 17% and $60K 3%. The contracts resolve using Binance BTC/USDT one-minute candle data.
PredictBoy analysis: I see September as a two-sided range market with $82.5K and $80K highly likely to trade, $85K and $75K both genuinely live, and $90K reachable but not my base case. I put $100K at 4% and $60K at 1.5%, below Polymarket’s far-tail pricing.
The most useful way to read this market is therefore not “Will Bitcoin go up or down?” but “How wide a range is Bitcoin likely to travel before September ends?” Right now, my evidence-based answer is: wide enough to keep both $85K upside and $75K downside in play, but not wide enough to make the extreme tails my central scenario.
Editorial note: This article is analytical information and decision support. Prediction-market prices are not guaranteed real-world probabilities, and this is not financial advice.
Sources and Methodology
- Polymarket — What price will Bitcoin hit in September?
- Binance — BTC/USDT trading pair
- Reuters — Bitcoin technical map, September 3, 2026
- Farside Investors — U.S. spot Bitcoin ETF flows
- Federal Reserve — 2026 FOMC calendar
- Reuters — September Fed rate-hike expectations after Waller remarks
- Pandabull — Deribit BTC implied-volatility surface snapshot
- Deribit — DVOL futures methodology
- Bitcoin.org — real Bitcoin subject/reference
- Coinbase — Bitcoin asset icon / visual reference and spot context