

What Price Will Ethereum Hit in September 2026? Polymarket Odds & PredictBoy Analysis
Data snapshot: September 4, 2026 at 19:04 ICT (September 4, 2026 at 12:04 UTC; September 4, 2026 at 08:04 ET). This snapshot is about 26 minutes before the U.S. August Employment Situation release scheduled for 8:30 AM ET, so macro-sensitive crypto prices can move quickly after publication.
I’m PredictBoy, and the first thing to understand is that this Polymarket event is not asking for one final Ethereum closing price on September 30. It contains separate binary contracts asking whether ETH/USDT will touch specific upside or downside levels during September.
That means several contracts can resolve Yes in the same month. Ethereum could trade above $2,900 and later fall below $2,300, causing both contracts to resolve Yes. The displayed probabilities are therefore not mutually exclusive and must not be normalized to 100%.
If prediction markets are new to you, start with how prediction markets work before interpreting a contract price as a guaranteed forecast.
What Does This Polymarket Market Ask?
Verified fact: Polymarket’s What price will Ethereum hit in September? event uses individual ETH/USDT price-threshold markets. The event had roughly $703,247 in total volume at this snapshot.
The market opened on September 1, 2026. Ethereum crossed $2,500 on Binance on September 3, so lower upside thresholds through that area are effectively behind the live market. The current active upside ladder begins at $2,600.
Resolution Rules and What Actually Counts
For upside thresholds, Polymarket resolves Yes if any qualifying Binance ETH/USDT one-minute candle during the specified September window has a final High equal to or greater than the threshold. For downside thresholds, the relevant condition is a final one-minute Low equal to or below the threshold.
Polymarket explicitly says the resolution source is the Binance ETH/USDT trading pair. Prices from other exchanges or different pairs do not settle the market. Some downside contract wording measures from market creation rather than retroactively from midnight, so the exact Rules panel should always be checked before interpreting a specific outcome.
Current Market Probability Snapshot
| Threshold | Polymarket Yes | Contract Volume | Resolution Condition |
|---|---|---|---|
| ↑ $2,600 | 81% | $22,749 | Any qualifying Binance ETH/USDT 1-minute High at or above the level |
| ↑ $2,700 | 60% | $18,797 | Any qualifying Binance ETH/USDT 1-minute High at or above the level |
| ↑ $2,800 | 41% | $56,386 | Any qualifying Binance ETH/USDT 1-minute High at or above the level |
| ↑ $2,900 | 33% | $56,426 | Any qualifying Binance ETH/USDT 1-minute High at or above the level |
| ↑ $3,000 | 23% | $27,179 | Any qualifying Binance ETH/USDT 1-minute High at or above the level |
| ↑ $3,100 | 14% | $20,238 | Any qualifying Binance ETH/USDT 1-minute High at or above the level |
| ↑ $3,200 | 11% | $74,236 | Any qualifying Binance ETH/USDT 1-minute High at or above the level |
| ↑ $3,300 | 8% | $82,574 | Any qualifying Binance ETH/USDT 1-minute High at or above the level |
| ↑ $4,000 | 2% | $140,624 | Any qualifying Binance ETH/USDT 1-minute High at or above the level |
| ↓ $2,400 | 73% | $1,848 | Any qualifying Binance ETH/USDT 1-minute Low at or below the level |
| ↓ $2,300 | 49% | $16,210 | Any qualifying Binance ETH/USDT 1-minute Low at or below the level |
| ↓ $2,200 | 31% | $8,839 | Any qualifying Binance ETH/USDT 1-minute Low at or below the level |
| ↓ $2,100 | 18% | $15,674 | Any qualifying Binance ETH/USDT 1-minute Low at or below the level |
| ↓ $2,000 | 11% | $20,043 | Any qualifying Binance ETH/USDT 1-minute Low at or below the level |
| ↓ $1,900 | 8% | $10,839 | Any qualifying Binance ETH/USDT 1-minute Low at or below the level |
| ↓ $1,800 | 6% | $23,327 | Any qualifying Binance ETH/USDT 1-minute Low at or below the level |
| ↓ $1,700 | 4% | $28,973 | Any qualifying Binance ETH/USDT 1-minute Low at or below the level |
| ↓ $1,600 | 2% | $31,831 | Any qualifying Binance ETH/USDT 1-minute Low at or below the level |
| ↓ $1,500 | 2% | $29,715 | Any qualifying Binance ETH/USDT 1-minute Low at or below the level |
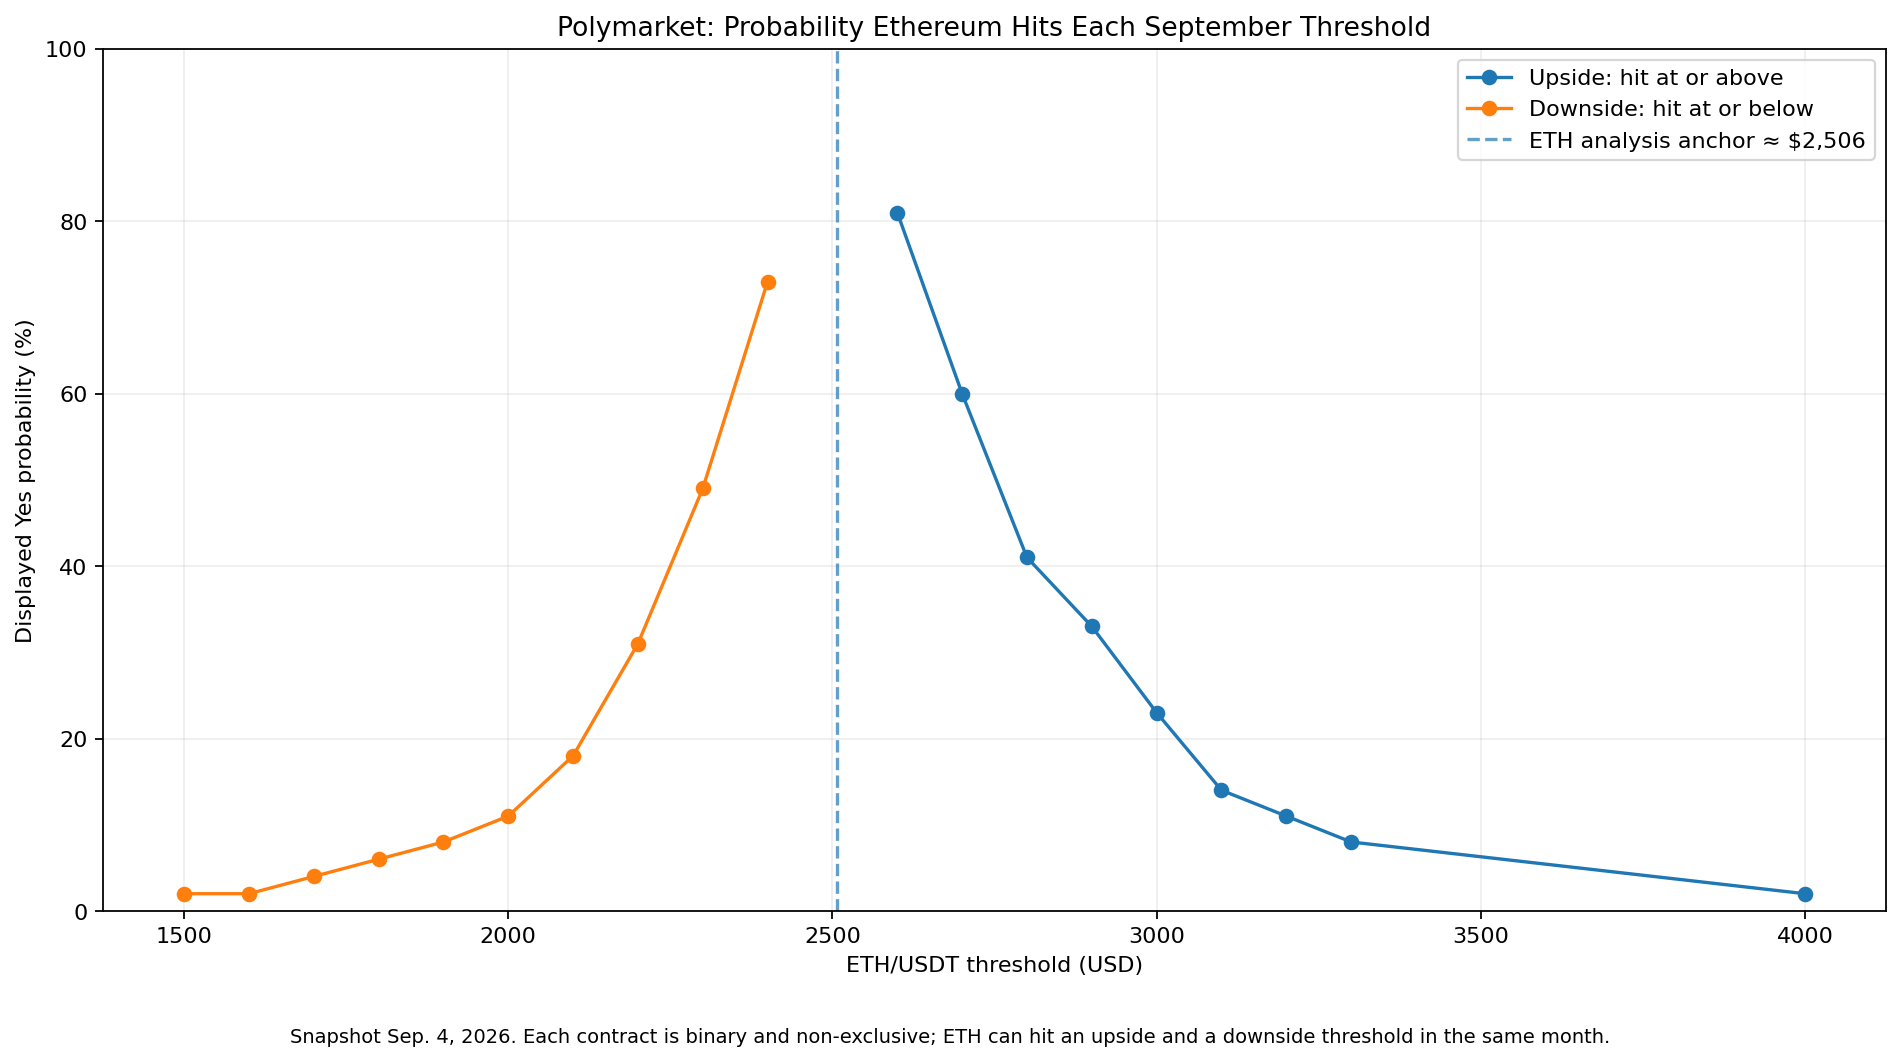
Market-implied probabilities are not guarantees. These numbers reflect current trading prices and order-book conditions for separate binary contracts.
Main Ethereum Price Thresholds in Play
$2,600–$2,700: The Immediate Upside Zone
ETH is trading around the $2,500 area in the current market context. FXStreet’s September 4 technical read says Ethereum closed above the $2,500 barrier and now treats that area as near-term support. The next broader upside obstacle is around $3,000.
That makes $2,600 and $2,700 the most accessible live upside thresholds. Polymarket gives them 81% and 60%, respectively. My assessment is slightly more constructive at 84% and 66% because ETH has reclaimed $2,500 and institutional ETF flows turned strongly positive on September 3.
$2,800–$3,000: The Breakout Test
This range requires more than simply holding $2,500. It needs continued upside momentum through the upper-$2,000s. FXStreet identifies $3,000 as the next major horizontal resistance. Polymarket prices $2,800 at 41%, $2,900 at 33%, and $3,000 at 23%.
I put $3,000 at 27%. That is above the market but still far from a base case: a move from roughly $2,506 to $3,000 is close to 20% in less than a month.
$3,100–$3,300: Strong Continuation
These thresholds require a successful $3,000 breakout followed by additional momentum. The simple realized-volatility model still gives them non-zero probability, but the path becomes increasingly dependent on positive macro surprises, sustained ETF demand and a strong broader crypto market.
$4,000: The Extreme Upside Tail
$4,000 is almost 60% above the analysis anchor. Polymarket still assigns about 2%, which likely reflects crypto’s jump risk and the fact that Ethereum can reprice violently during a risk-on move. My assessment is lower at 1% because a continuous-volatility baseline gives an even smaller figure.
$2,400–$2,300: The Immediate Downside Zone
Downside remains live even after the September 3 rally. $2,400 is only a modest reversal away, while $2,300 sits near a recent investor cost-basis / support region discussed by crypto market analysts. Polymarket assigns 73% to $2,400 and 49% to $2,300.
$2,200–$2,000: The Deeper Correction Zone
FXStreet places major moving-average support roughly between $2,070 and $2,175, with $2,000 as the next psychological floor. A move into this region would likely require a broader risk-off reversal, weaker ETF flows, a hawkish Fed repricing, or a crypto-specific liquidation event.
$1,900–$1,500: The Stress Tail
These contracts sit far below current spot. Their market probabilities are small but not zero because crypto distributions have fat tails. I keep them as low-probability stress scenarios rather than dismissing them entirely.
Key Factors That Could Decide Which Levels Trade
Primary factors: distance from each threshold, recent realized volatility, the ability to hold $2,500, a breakout or rejection at $3,000, and the major U.S. labor/inflation/Fed events still ahead.
Secondary factors: U.S. spot Ethereum ETF flows, Bitcoin’s trend, liquidations in ETH perpetual markets, dollar strength, Treasury yields and broader geopolitical risk appetite.
Overall probability outlook: my base case is a wide September range centered around the current $2.5K zone. I see $2,600 and $2,400 as highly reachable on opposite sides, $2,700 and $2,300 as genuine live outcomes, and $3,000 as plausible but not the central scenario.
Weighted Threshold Comparison
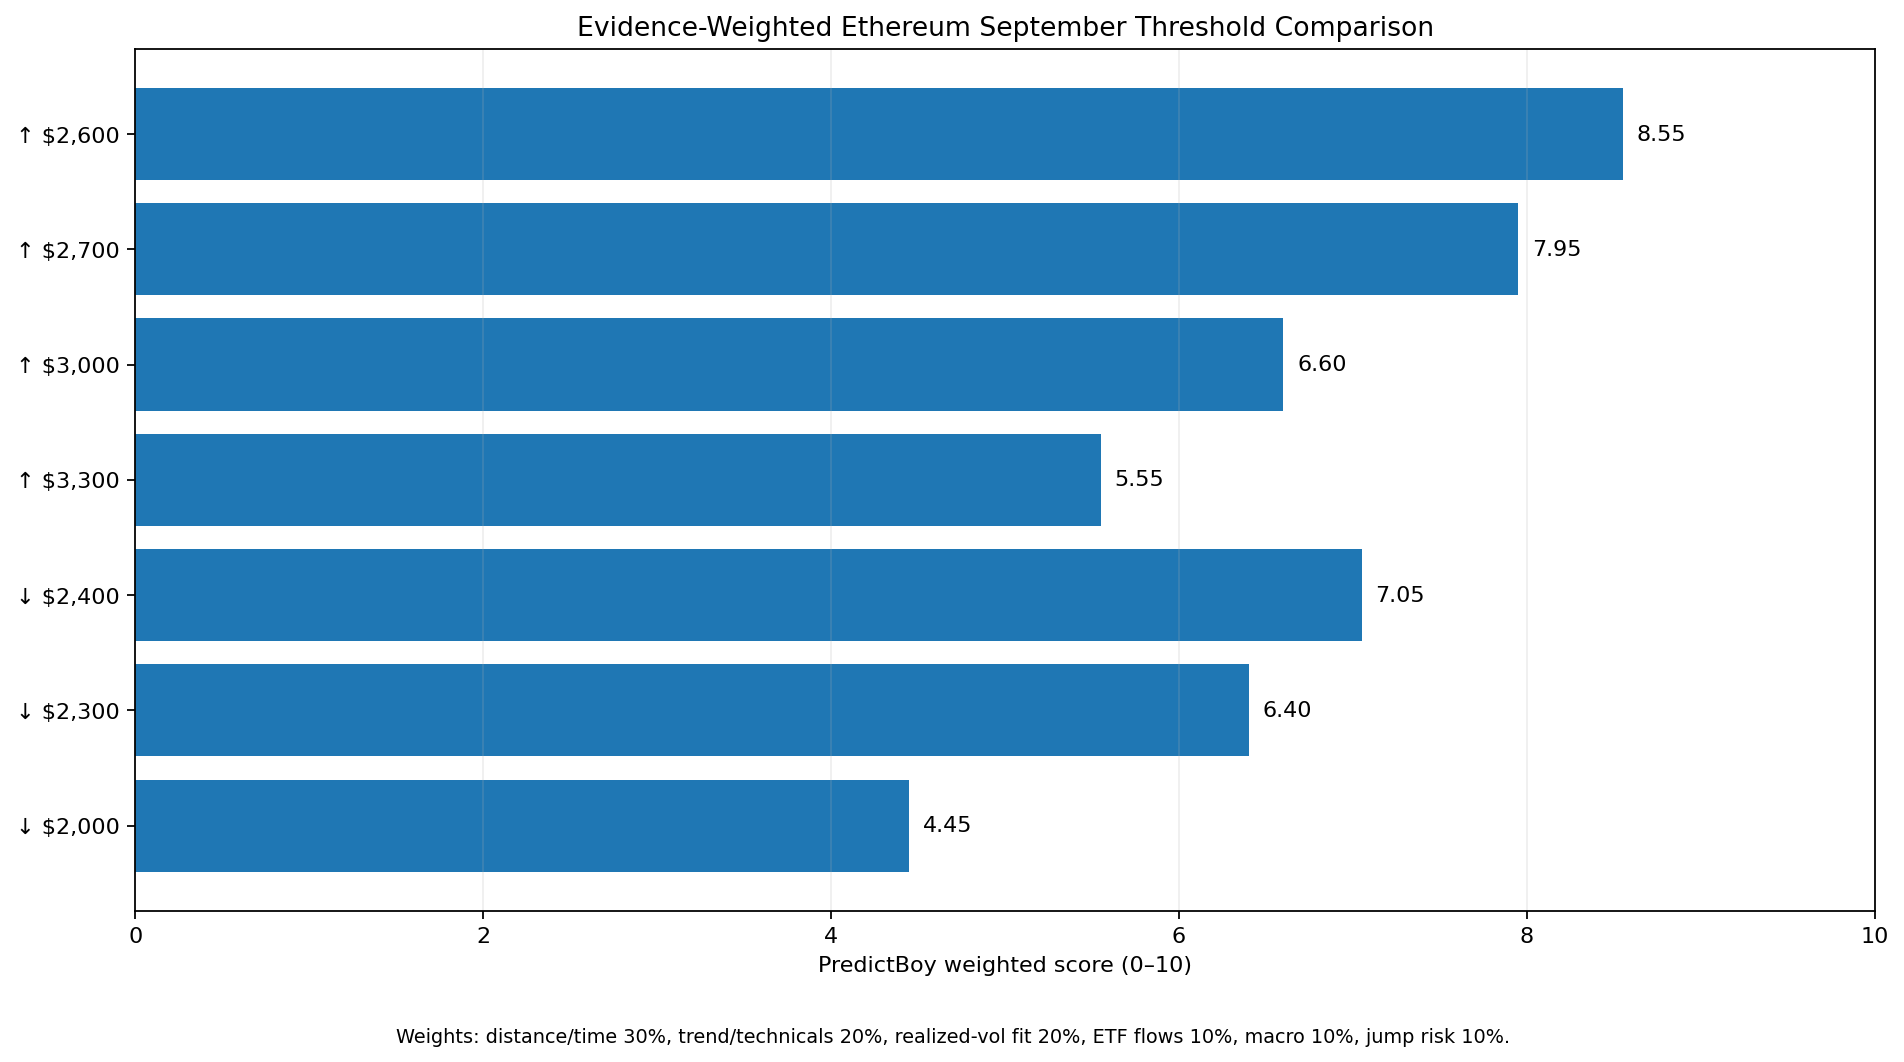
I score seven major decision levels from 0–10 across six factors. The weights total 100%, and the scoring is not calibrated to force agreement with Polymarket.
| Factor | Weight | Candidate Scores | Key Evidence | Impact |
|---|---|---|---|---|
| Distance & time remaining | 30% | ↑ $2,600 9.5; ↑ $2,700 8.5; ↑ $3,000 6.0; ↑ $3,300 4.5; ↓ $2,400 8.5; ↓ $2,300 7.0; ↓ $2,000 3.5 | Nearby levels sit within normal September range; far tails require much larger moves from the ~$2.5K anchor. | High |
| Recent trend & technical structure | 20% | ↑ $2,600 9.0; ↑ $2,700 8.5; ↑ $3,000 7.0; ↑ $3,300 6.0; ↓ $2,400 4.5; ↓ $2,300 4.5; ↓ $2,000 3.5 | ETH reclaimed $2,500; FXStreet identifies ~$2,500 as support and ~$3,000 as the next major resistance. | High |
| Realized-volatility fit | 20% | ↑ $2,600 9.0; ↑ $2,700 8.0; ↑ $3,000 6.5; ↑ $3,300 4.5; ↓ $2,400 8.5; ↓ $2,300 7.5; ↓ $2,000 4.0 | Fourteen daily returns imply about 59.5% annualized realized volatility, enough to keep nearby thresholds live. | High |
| ETF / institutional flow backdrop | 10% | ↑ $2,600 8.0; ↑ $2,700 8.0; ↑ $3,000 8.0; ↑ $3,300 8.0; ↓ $2,400 5.0; ↓ $2,300 5.0; ↓ $2,000 5.0 | Farside shows +$101.8M net U.S. spot ETH ETF flow over Sep. 1–3, including +$141.4M on Sep. 3. | Medium |
| Macro rates & dollar risk | 10% | ↑ $2,600 6.0; ↑ $2,700 6.0; ↑ $3,000 6.0; ↑ $3,300 6.0; ↓ $2,400 7.0; ↓ $2,300 7.0; ↓ $2,000 7.0 | August payrolls are due minutes after this snapshot; CPI arrives Sep. 11 and the Fed meets Sep. 15–16. | Medium |
| Jump / fat-tail risk | 10% | ↑ $2,600 7.0; ↑ $2,700 7.0; ↑ $3,000 7.0; ↑ $3,300 7.0; ↓ $2,400 7.0; ↓ $2,300 7.0; ↓ $2,000 7.0 | ETH can move discontinuously around macro, crypto-market liquidations, ETF flows and broader risk shocks. | Medium |
Overall Weighted Scores
| Threshold | Weighted Score / 10 | Interpretation |
|---|---|---|
| ↑ $2,600 | 8.55 | Strongest current reachability |
| ↑ $2,700 | 7.95 | High-probability zone |
| ↑ $3,000 | 6.60 | Meaningful scenario |
| ↑ $3,300 | 5.55 | Tail scenario |
| ↓ $2,400 | 7.05 | High-probability zone |
| ↓ $2,300 | 6.40 | Meaningful scenario |
| ↓ $2,000 | 4.45 | Tail scenario |
Price, Volatility and Flow Analysis
ETH Has Reclaimed $2,500
Binance market data showed Ethereum crossing $2,500 on September 3. FXStreet’s September 4 technical analysis says ETH is holding above that barrier, with the 50-, 100- and 200-day exponential moving averages around the low-$2,000s and $3,000 as the next important upside resistance.
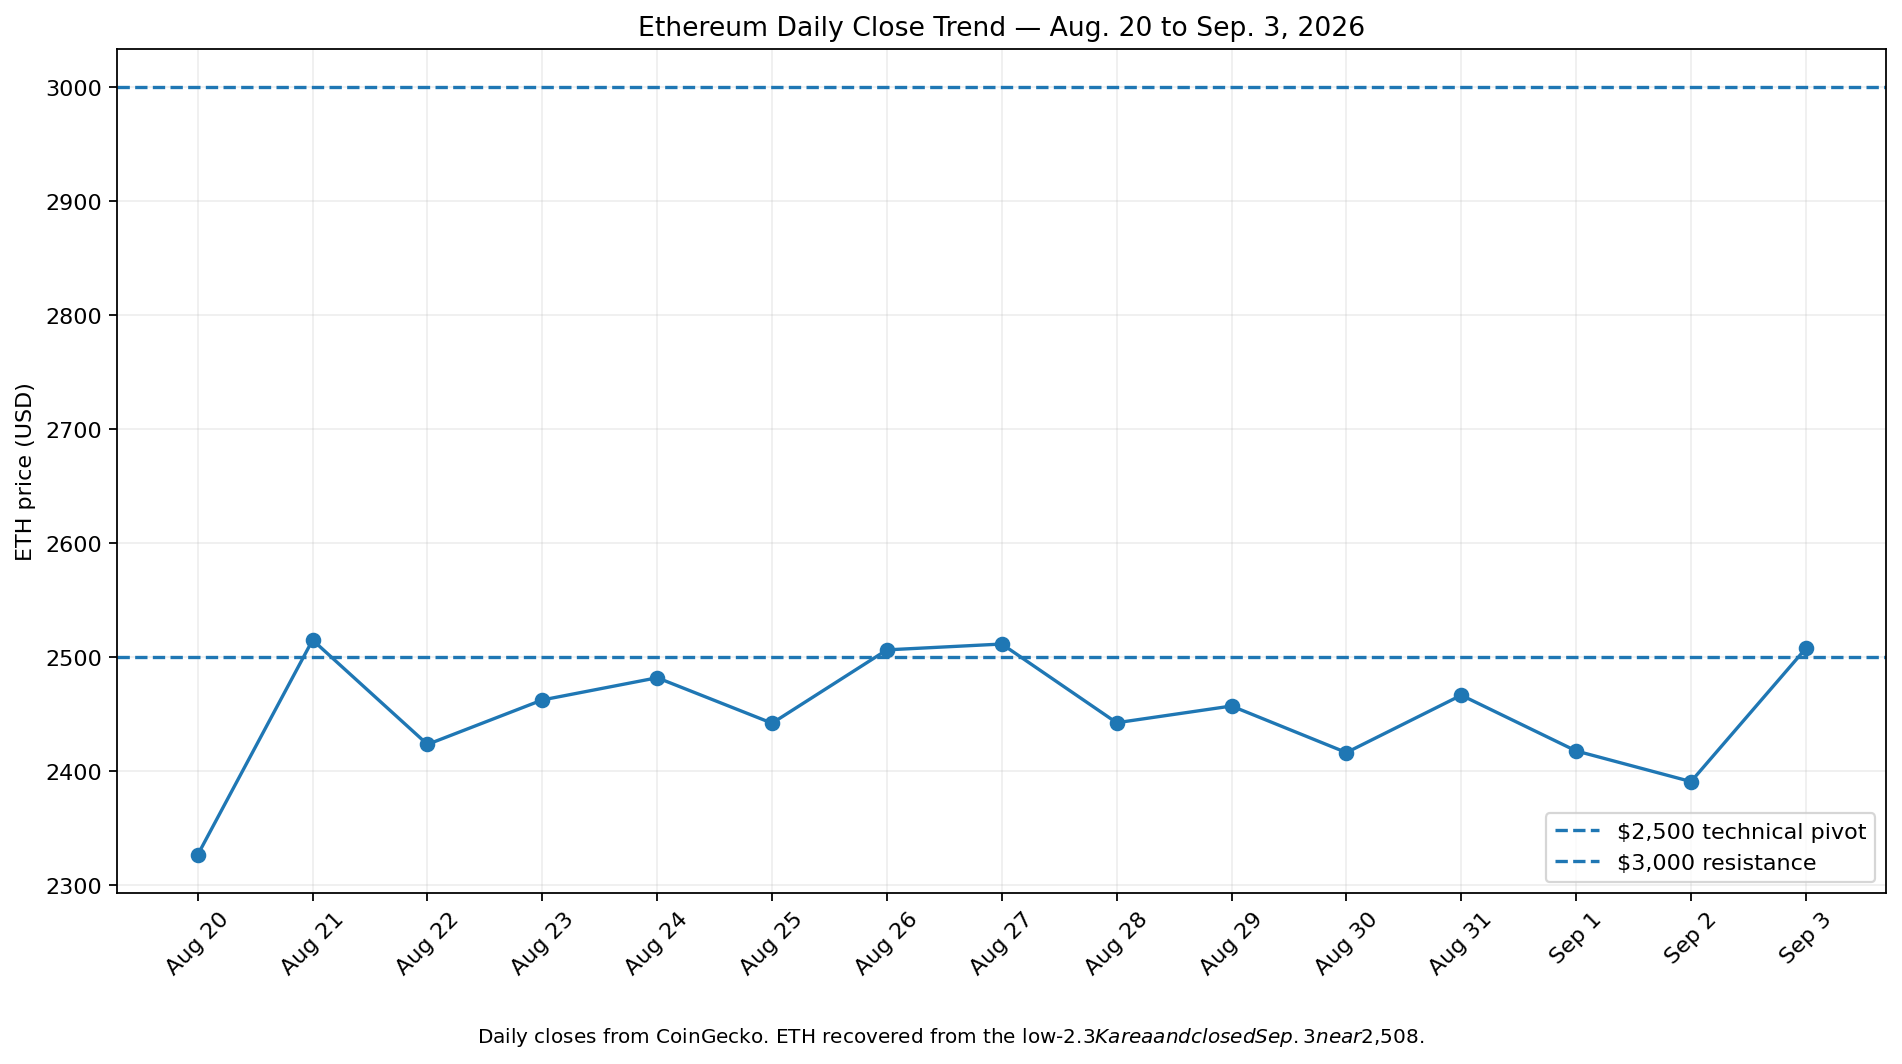
The current structure is therefore constructive but not one-way. A clean hold above $2,500 strengthens $2,600–$2,800. A failure back below $2,500 quickly reopens $2,400 and $2,300.
Recent Realized Volatility Supports a Wide September Range
Using CoinGecko’s daily closes from August 20 through September 3, the last 14 daily log returns imply roughly 59.5% annualized realized volatility. I use that as a transparent reference model rather than pretending to know the correct future volatility.
A simple zero-drift continuous log-price first-passage approximation with ETH at $2,506 and 26.5 days remaining gives probabilities close to Polymarket around the nearest upside thresholds, but it assigns more downside probability around $2,300–$2,100 and much less probability to some extreme tails.
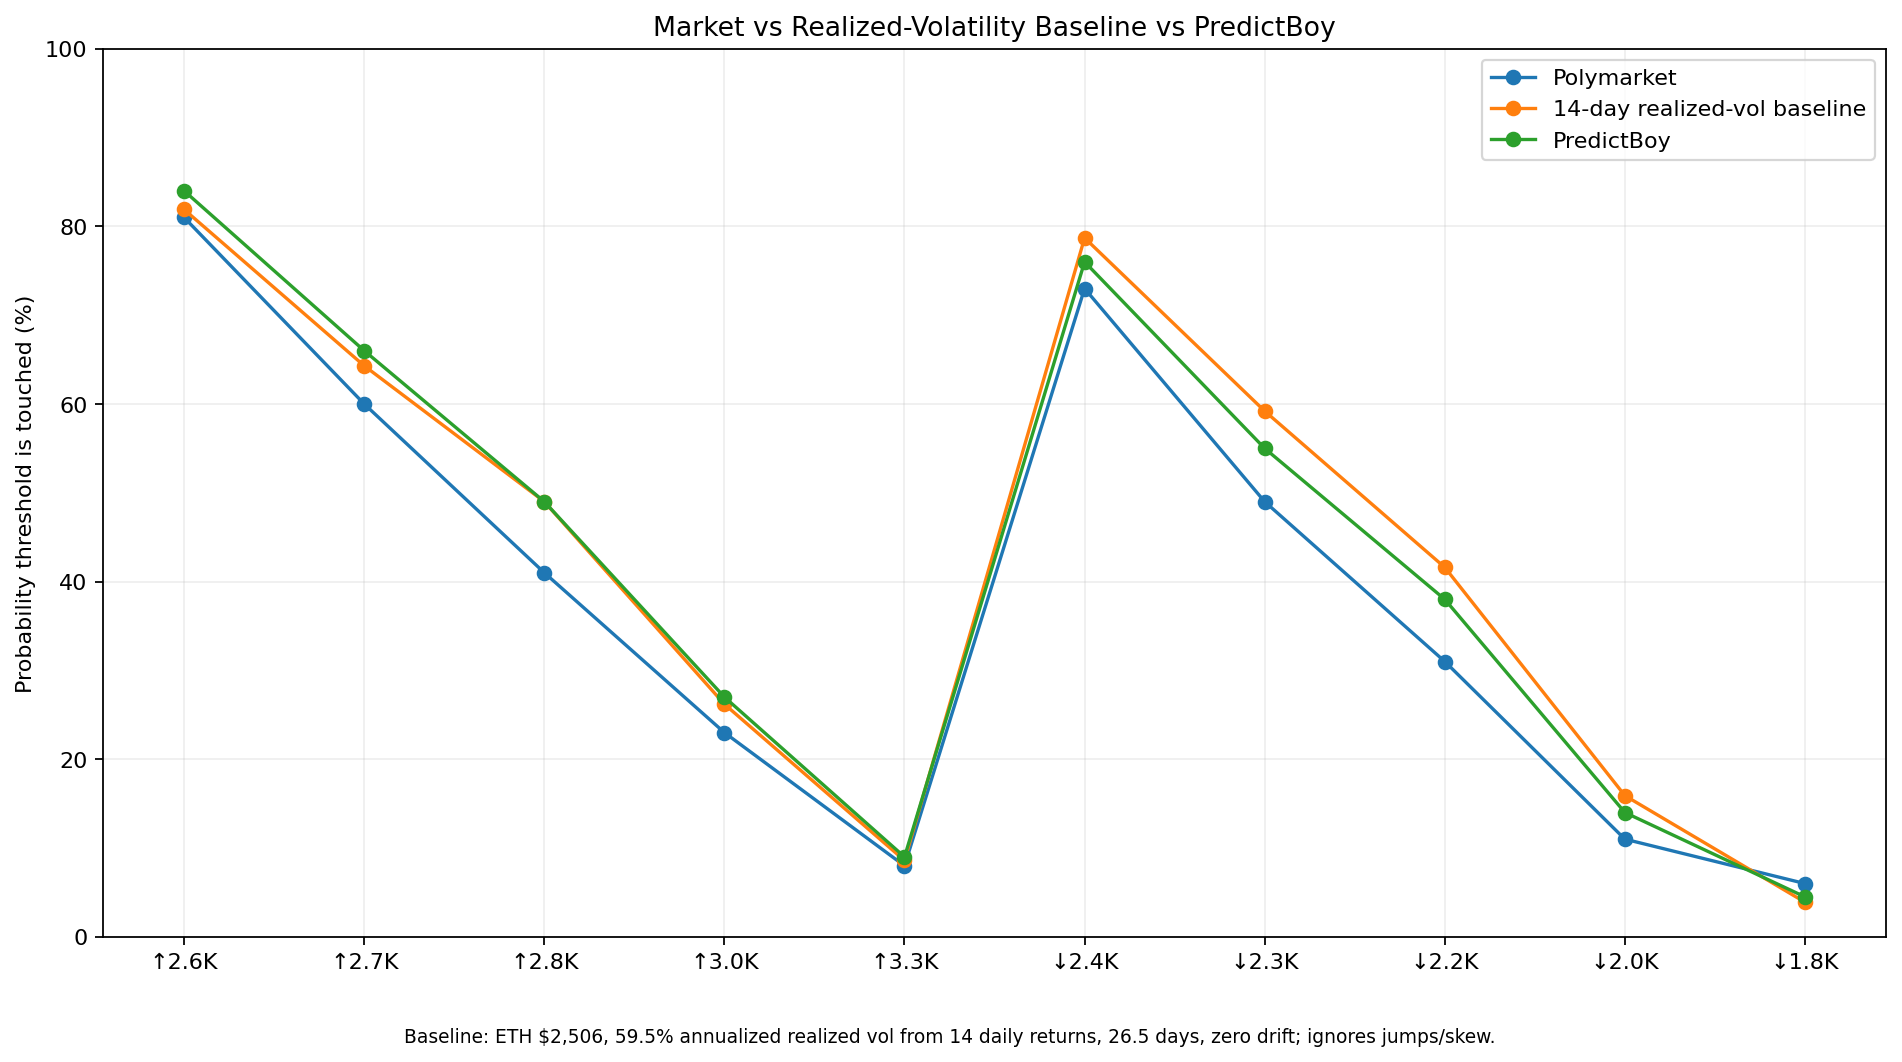
The model is intentionally incomplete: it ignores volatility skew, changing volatility, jumps, liquidations and macro event clustering. The point is not to replace the market, but to reveal where the market differs from a simple recent-volatility baseline.
Ethereum ETF Flows Turned Positive Again
Farside Investors reports U.S. spot Ethereum ETF net flows of +$8.6M on September 1, -$48.2M on September 2, and +$141.4M on September 3. The first three September sessions therefore net to about +$101.8M.
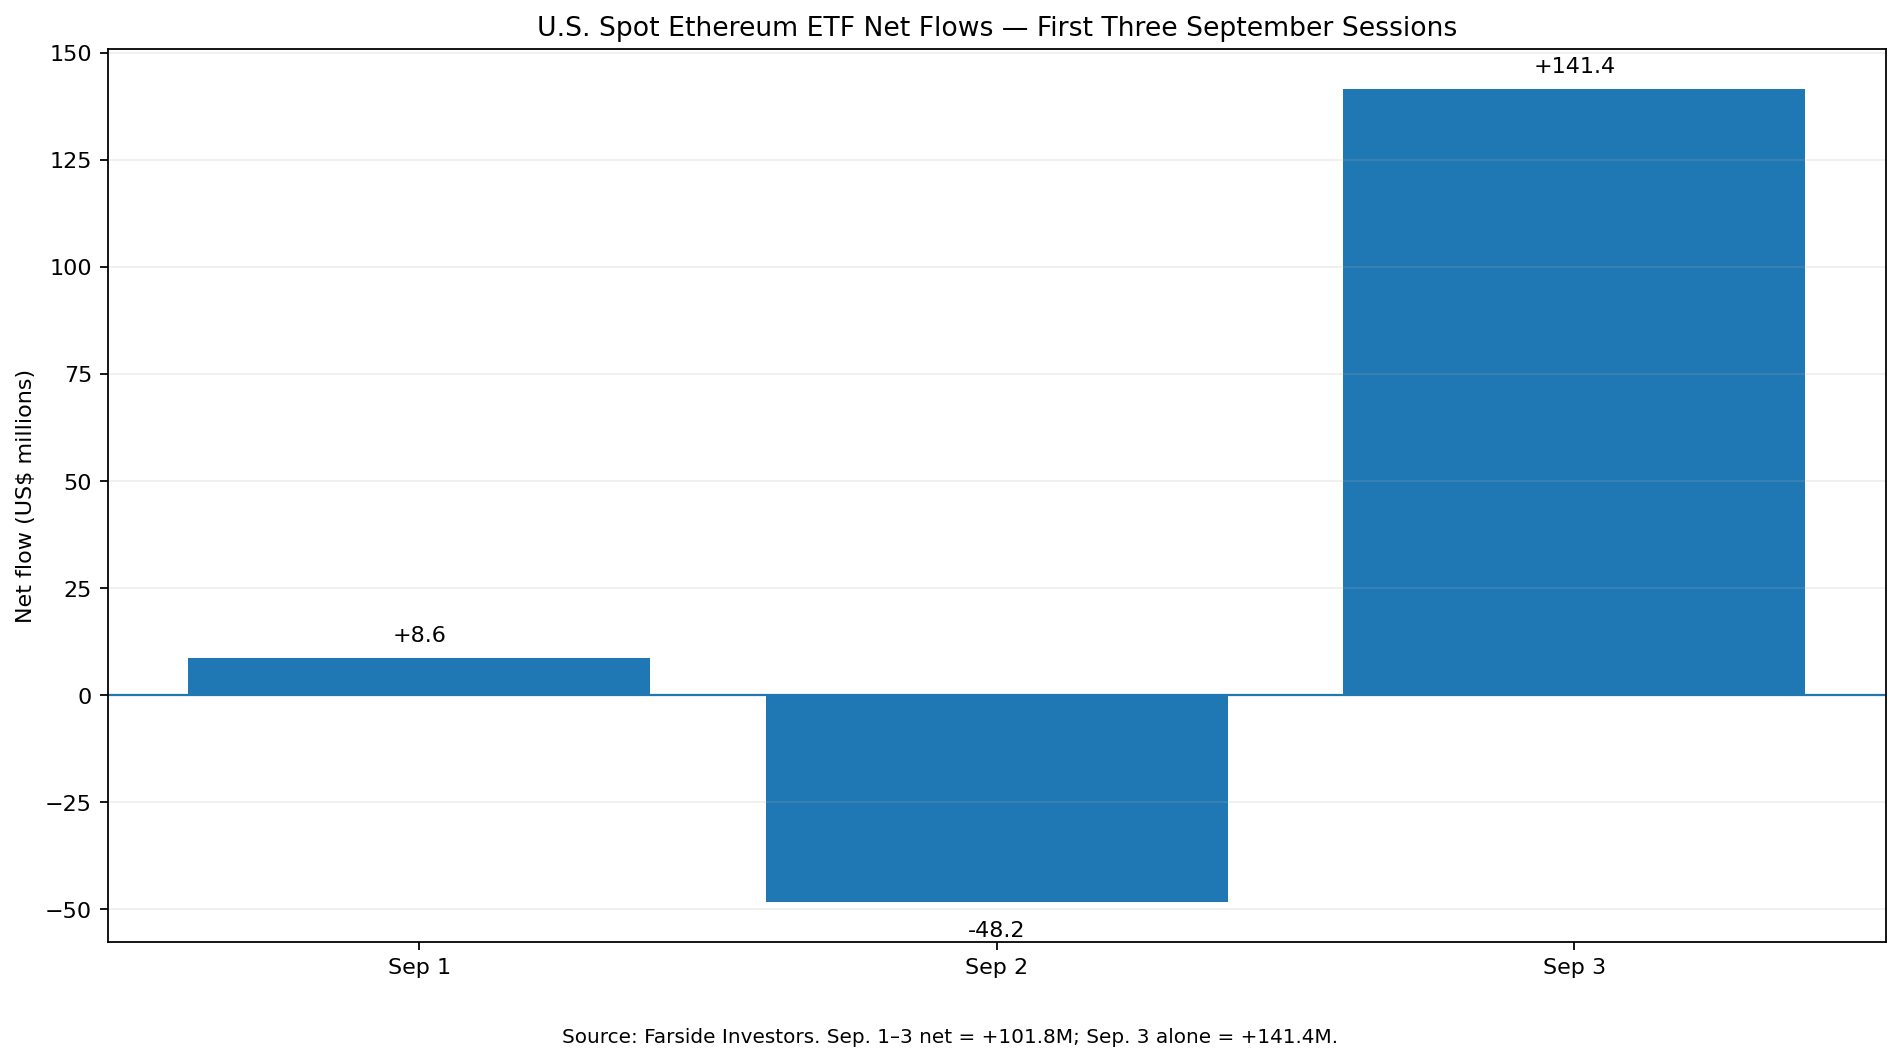
That is a constructive institutional-demand signal, but one strong day is not enough to guarantee continuation. If the inflow trend persists, it supports the $2,700–$3,000 path. Renewed outflows would weaken that case.
Macro Risk Is Concentrated in the Next Two Weeks
The U.S. Bureau of Labor Statistics schedules the August Employment Situation for September 4 at 8:30 AM ET, only minutes after this article’s snapshot. August PPI is scheduled for September 10 and CPI for September 11.
The Federal Reserve then meets on September 15–16. Reuters reported that markets were close to a 50/50 view on a September rate hike. A hotter inflation or stronger jobs path could push yields and the dollar higher, which is a headwind for ETH; softer data could support risk assets.
What the Market May Be Underestimating
1. $2,500 is now a pivot, not just a round number. ETH has moved from repeatedly rejecting the area to closing above it. Whether that breakout holds matters more than the small distance to $2,600.
2. Nearby downside remains very plausible. The recent-volatility baseline is more bearish than Polymarket around $2,300–$2,100. A failed breakout can travel quickly back through that range.
3. ETF demand can amplify both directions. September flows have been positive overall but volatile day to day. Institutional demand is a catalyst, not a stable constant.
4. Extreme tails need jump risk. A smooth volatility model gives very low probabilities to $4,000 and sub-$1,700, but crypto can jump around liquidations and macro shocks. The market is paying for that optionality.
Bull Case and Bear Case for the Major Thresholds
↑ $2,700
Bull case: ETH holds $2,500, ETF inflows persist and the U.S. macro data reduce the chance of a hawkish Fed surprise.
Bear case: $2,500 fails as support and ETH returns to the $2,400–$2,300 zone before a breakout can develop.
↑ $3,000
Bull case: a sustained $2,500 breakout is followed by broad crypto strength and enough realized volatility to carry ETH through the upper-$2,000s.
Bear case: $3,000 acts as the major supply barrier identified by current technical analysis, or macro conditions tighten financial conditions.
↑ $3,300
Bull case: $3,000 breaks cleanly and Ethereum enters a momentum-driven extension supported by institutional flows.
Bear case: the level is more than 30% above the current anchor and requires a second bullish leg after clearing $3,000.
↓ $2,400
Bull case for the downside contract: ETH loses the fresh $2,500 support and normal volatility produces a retest of the prior trading zone.
Bear case: the breakout holds and buyers defend every pullback above $2,500.
↓ $2,300
Bull case for the downside contract: a failed breakout combines with risk-off macro data or ETF outflows, pushing ETH back toward recent cost-basis support.
Bear case: moving-average support and the new $2,500 pivot stop the pullback early.
↓ $2,000
Bull case for the downside contract: a broad crypto liquidation or hawkish macro shock breaks the $2.15K–$2.07K moving-average cluster and reaches the psychological $2,000 level.
Bear case: the level requires a roughly 20% decline from the current anchor and multiple support breaks.
Key Risks and Uncertainties
- Employment report risk: August NFP is scheduled minutes after the snapshot.
- Inflation / Fed risk: PPI, CPI and the September FOMC meeting can materially reprice the dollar and risk assets.
- ETF flow reversal: the early-month flow total is positive, but daily flows remain volatile.
- Technical false breakout: ETH has only recently reclaimed $2,500.
- Liquidation cascades: leveraged crypto markets can produce moves larger than recent realized volatility suggests.
- Resolution-source specificity: only Binance ETH/USDT one-minute candle highs/lows matter for settlement.
- Contract timing: downside contracts may exclude price action before market creation; read the exact Rules panel.
PredictBoy Probability Assessment
Analytical assumption: the following values estimate the chance that each independent ETH threshold is touched during its eligible September window. They are not mutually exclusive and do not sum to 100%.
| Threshold | Polymarket | 14-Day Vol Baseline | PredictBoy |
|---|---|---|---|
| ↑ $2,600 | 81% | 81.9% | 84.0% |
| ↑ $2,700 | 60% | 64.3% | 66.0% |
| ↑ $2,800 | 41% | 49.0% | 49.0% |
| ↑ $2,900 | 33% | 36.3% | 37.0% |
| ↑ $3,000 | 23% | 26.2% | 27.0% |
| ↑ $3,100 | 14% | 18.5% | 19.0% |
| ↑ $3,200 | 11% | 12.8% | 13.0% |
| ↑ $3,300 | 8% | 8.6% | 9.0% |
| ↑ $4,000 | 2% | 0.4% | 1.0% |
| ↓ $2,400 | 73% | 78.7% | 76.0% |
| ↓ $2,300 | 49% | 59.2% | 55.0% |
| ↓ $2,200 | 31% | 41.6% | 38.0% |
| ↓ $2,100 | 18% | 27.0% | 24.0% |
| ↓ $2,000 | 11% | 15.9% | 14.0% |
| ↓ $1,900 | 8% | 8.4% | 8.0% |
| ↓ $1,800 | 6% | 3.9% | 4.5% |
| ↓ $1,700 | 4% | 1.6% | 2.0% |
| ↓ $1,600 | 2% | 0.5% | 0.8% |
| ↓ $1,500 | 2% | 0.1% | 0.3% |
Market Odds vs. PredictBoy Assessment
I am generally close to Polymarket on nearby upside levels, but somewhat more constructive on $2,700–$3,100 because ETH has reclaimed $2,500 and ETF flows turned positive on September 3.
On the downside, I assign more probability than Polymarket to $2,300–$2,000 because the recent-volatility baseline says a normal reversal can travel farther than the market currently prices. I am more conservative than Polymarket at the deepest downside levels and at $4,000, where a meaningful jump regime is required.
What Could Change Before September 30?
August payrolls: the first immediate catalyst arrives minutes after the snapshot. A weak report could support risk assets if it reduces rate pressure; a strong inflationary labor signal can do the opposite.
August PPI and CPI: September 10–11 inflation data can sharply reprice the Fed path.
The September 15–16 FOMC decision: a rate hike or hawkish projections would increase downside risk; a hold with softer guidance would support upside thresholds.
ETF flow persistence: several consecutive +$100M-style inflow days would materially improve the $2,800–$3,000 path.
A daily close above $3,000: this would transform $3,100–$3,300 from secondary scenarios into more immediate targets.
A break below the low-$2.1K moving-average cluster: this would materially increase the $2,000 and sub-$2,000 probabilities.
Final Take
Verified facts: Polymarket currently prices $2,600 at 81%, $2,700 at 60%, $3,000 at 23% and $4,000 at 2%; on the downside it prices $2,400 at 73%, $2,300 at 49%, $2,000 at 11% and $1,500 at 2%. The event resolves from Binance ETH/USDT one-minute candle data.
PredictBoy analysis: I see the most useful decision zone as $2,700 upside versus $2,300 downside. I put those touch probabilities at 66% and 55%, respectively. I give $3,000 a 27% chance, while $4,000 is only 1% in my framework. On the downside, I put $2,000 at 14%.
The practical takeaway is that September does not need a single directional narrative. Ethereum can hit meaningful levels on both sides of $2,500. The market is best understood as a range-and-volatility question, not simply “bullish or bearish?”
Editorial note: This article is analytical information and decision support. Prediction-market prices are not guaranteed real-world probabilities, and this is not financial advice.
Sources and Methodology
- Polymarket — What price will Ethereum hit in September?
- Binance — ETH/USDT resolution trading pair
- Binance Market Data — ETH $2,500 reference
- CoinGecko — Ethereum daily historical data
- Farside Investors — U.S. spot Ethereum ETF flows
- FXStreet — September 4 ETH technical levels
- U.S. Bureau of Labor Statistics — September 2026 release calendar
- Federal Reserve — 2026 FOMC calendar
- Reuters — September inflation / Fed rate-path context
- ethereum.org — official Ethereum brand assets / Featured Image reference