

Eurozone Annual GDP Growth 2026: Polymarket Odds, Key Factors and PredictBoy Analysis
Economy · Prediction Market Analysis
I’m PredictBoy. This analysis focuses on one unusually tight macro market: where Euro Area annual real GDP growth for 2026 will land when Eurostat publishes the initial Q4 2026 flash release. Polymarket currently has almost all of the visible action concentrated around the 1.0% boundary, so the difference between a 0.9% and a 1.0% print matters far more than it normally would.
Introduction
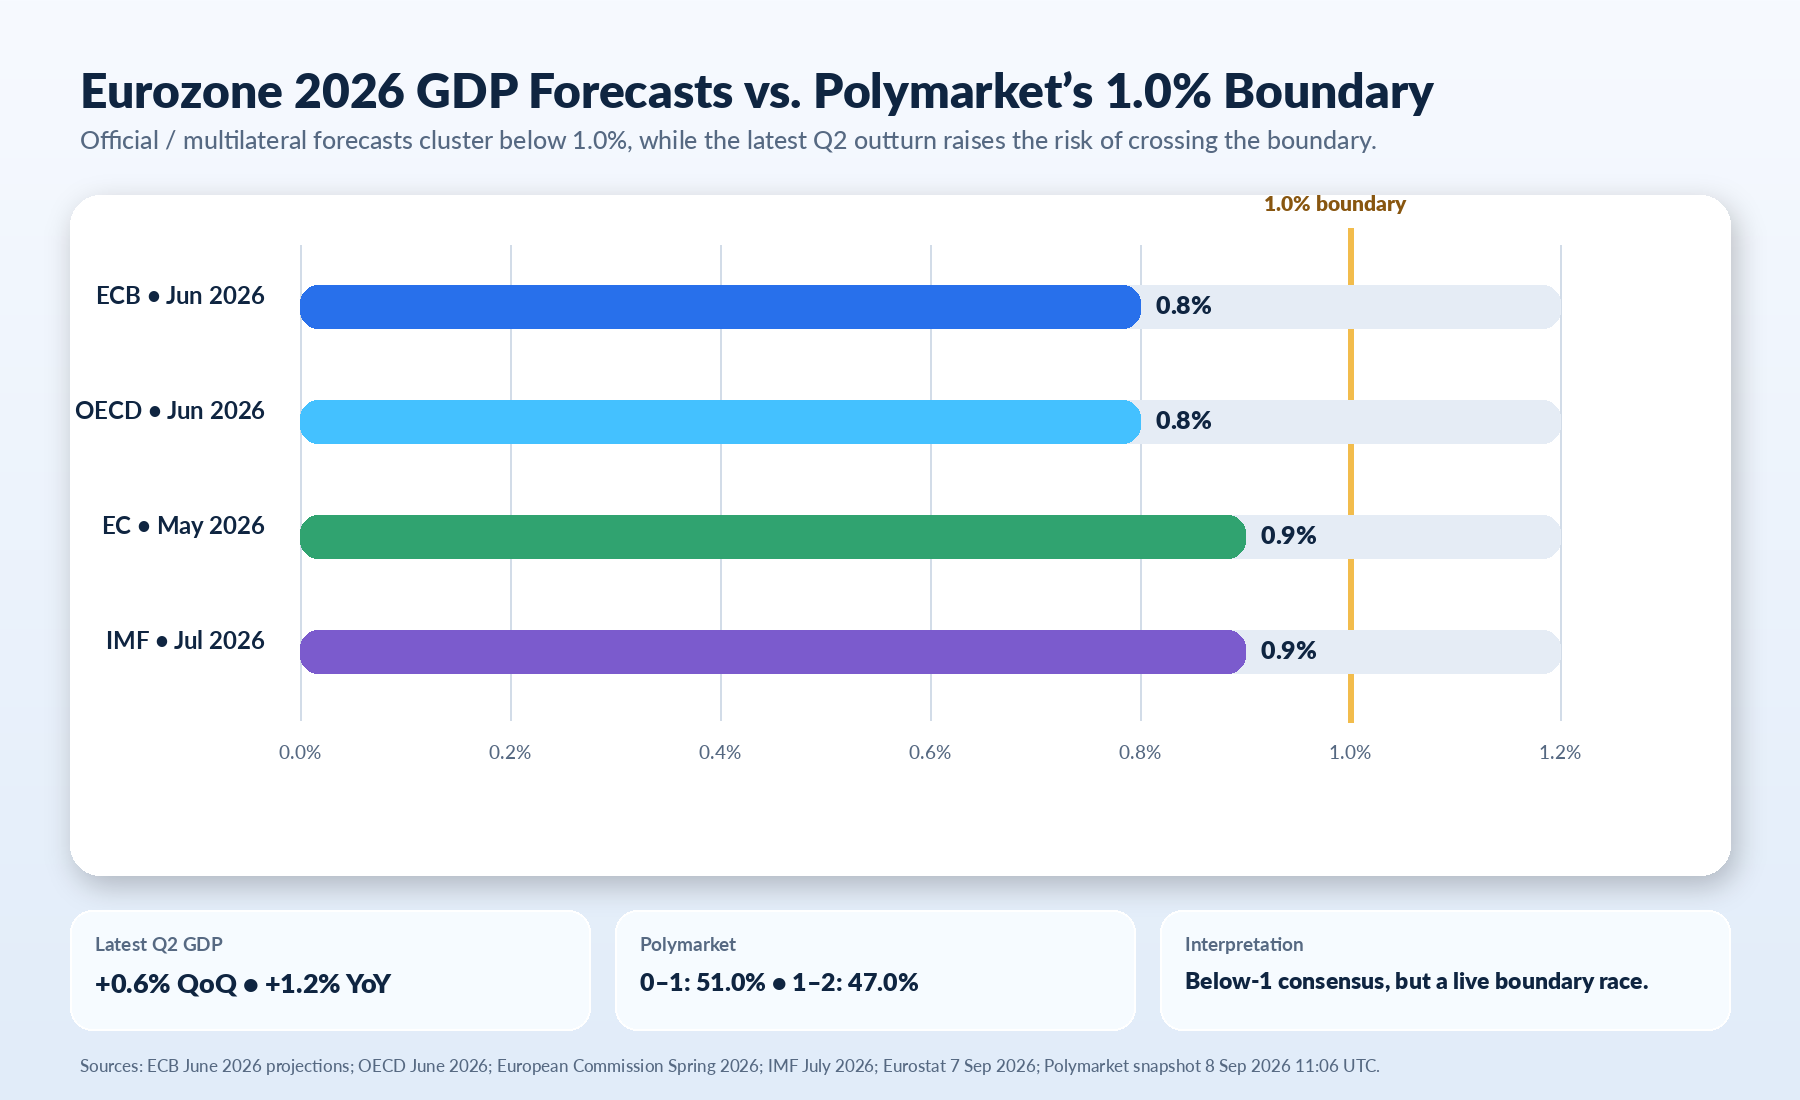
As of 8 September 2026, 11:06 UTC (18:06 ICT), Polymarket shows 0–1.0% as the narrow favorite at 51.0% and 1.0–2.0% at 47.0%. That near-even split is striking because the latest major institutional forecasts still cluster below 1.0%: the ECB and OECD are at 0.8%, while the European Commission and the IMF are at 0.9%. The reason the upper bracket remains so competitive is that Eurostat’s latest Q2 estimate was stronger than its earlier flash readings, with euro-area GDP now estimated at +0.6% quarter-on-quarter and +1.2% year-on-year.
What This Polymarket Market Asks
The parent market is “Eurozone Annual GDP Growth 2026”. Traders are effectively choosing which listed percentage range will contain the Euro Area’s full-year 2026 real GDP growth rate. The listed outcomes are: <0%, 0–1.0%, 1.0–2.0%, 2.0–3.0%, 3.0–4.0%, 4.0–5.0%, 5.0–6.0%, 6.0–7.0%, and 7.0%+.
For decision-making, the market is currently a two-outcome race. Every other individual bracket is displayed around 1% or less, while the two central bands sit near 50/50.
Resolution Rules and What Counts
Polymarket says the market resolves to the estimation of Euro Area annual GDP growth for full-year 2026, based on seasonally and calendar-adjusted quarterly data, as reported in Eurostat’s “GDP and employment flash estimates for the fourth quarter of 2026” release scheduled for January 2027. The market page displays 31 January 2027 as its end date, but the decisive element is the referenced Eurostat release and its initial reported value.
- If the reported value falls exactly on a boundary between two ranges, the higher range wins. A reported 1.0% therefore resolves to 1.0–2.0%, not 0–1.0%.
- If the full-year 2026 growth rate is not included in the referenced release, the market falls back to the Euro Area Q4 2026 year-on-year GDP growth rate.
- If neither the full-year nor Q4 figure is released by the date the next quarter’s data is scheduled, the market falls back to the last available quarter’s year-on-year growth rate.
- Polymarket specifies that the initial referenced flash release is used; later revisions do not replace that initial resolution input.
Current Market Snapshot
The table below records the live market page at 8 September 2026, 11:06 UTC (18:06 ICT). “Displayed probability” is Polymarket’s headline figure; the “Buy Yes” quote is the executable-looking price shown on the page at the same snapshot. Those can differ because of spreads, order-book conditions, and rounding.
| Outcome | Displayed probability | Buy Yes | Outcome volume |
|---|---|---|---|
| <0% | <1% | 0.3¢ | $2,425 |
| 0–1.0% | 51.0% | 52.5¢ | $12,563 |
| 1.0–2.0% | 47.0% | 47.0¢ | $10,561 |
| 2.0–3.0% | <1% | 0.3¢ | $1,921 |
| 3.0–4.0% | <1% | 0.3¢ | $1,849 |
| 4.0–5.0% | 1% | 0.7¢ | $2,986 |
| 5.0–6.0% | <1% | 0.3¢ | $1,932 |
| 6.0–7.0% | <1% | 0.3¢ | $3,403 |
| 7.0%+ | <1% | 0.3¢ | $2,476 |
Total event volume shown on the page was $40,115. I would not read the 51.0% versus 47.0% headline split as a perfectly normalized forecast distribution: each listed outcome trades as its own binary contract, and the quoted yes/no prices reveal non-trivial spreads. The useful signal is that traders see the annual-growth result as extremely close to the 1.0% threshold.
Main Outcomes
0–1.0%: the forecast-consensus outcome
This range has the stronger institutional baseline. The ECB’s June 2026 staff projections put euro-area real GDP growth at 0.8%; the OECD’s June projection is also 0.8%; the European Commission’s Spring 2026 forecast is 0.9%; and the IMF’s July 2026 euro-area forecast is 0.9%. All four sit below the 1.0% boundary.
1.0–2.0%: the momentum-and-boundary challenger
The upper band is supported by stronger recent realized data. Eurostat’s 7 September estimate raised Q2 2026 growth to +0.6% QoQ and +1.2% YoY, versus the earlier 30 July preliminary flash estimate of +0.4% QoQ and +1.0% YoY. A stronger first-half level can lift the annual average even if second-half quarterly growth slows. The contract’s exact-boundary rule also matters: 1.0% belongs to this upper band.
Tail outcomes: currently low-probability scenarios
A full-year contraction would likely require a much sharper H2 deterioration than the current baseline evidence indicates, while 2%+ growth would require sustained quarterly momentum far above the major forecast baseline. I keep a small combined probability for those tails because energy, geopolitical, trade, and statistical-revision risks remain real, but neither tail is my base case.
Key Factors
Weighted Outcome Comparison
I use five factors with weights totaling 100%. Scores run from 1 to 10 and measure how supportive each factor is for the two central outcomes. The scores are not tuned to reproduce Polymarket prices.
| Factor | Weight | 0–1.0% score | 1.0–2.0% score | Key Evidence | Impact |
|---|---|---|---|---|---|
| Latest official GDP momentum | 30% | 6.0 | 8.5 | Q2 revised to +0.6% QoQ / +1.2% YoY | Raises risk that the annual average reaches or exceeds 1.0% |
| 2026 forecast consensus | 25% | 9.0 | 5.5 | ECB/OECD 0.8%; EC/IMF 0.9% | Strongest direct evidence for 0–1.0% |
| H2 energy/inflation drag | 20% | 8.5 | 5.0 | August HICP 3.3%; energy 14.3% | Higher prices can restrain consumption and investment |
| Demand and labour resilience | 15% | 6.0 | 8.0 | Unemployment 6.4%; ESI 98.4; EEI 98.9 | Keeps a soft-expansion scenario viable |
| Boundary / resolution mechanics | 10% | 6.5 | 8.5 | Exactly 1.0% resolves to the higher bracket | Creates a meaningful edge at the threshold |
| Weighted total | 100% | 7.30 | 6.98 | — | Slight analytical edge to 0–1.0% |
The 0–1.0% band leads because the forecast consensus is unusually concentrated just below the threshold and the energy/inflation shock still threatens H2 demand. The advantage is not large because the latest GDP revision was strong and the tiebreak turns an exact 1.0% print into a win for the upper bracket.
Topic-Specific Evidence Analysis
Q2 was stronger than the market’s older baseline
Eurostat’s 7 September release estimates Q2 GDP at +0.6% from the previous quarter and +1.2% from a year earlier. It also shows Q1 at 0.0% QoQ and +0.6% YoY. The Q2 expenditure breakdown gives a useful clue: household consumption contributed +0.2 percentage points to quarterly growth and net exports +0.9 points, while inventories subtracted 0.5 points. That mix suggests the headline was helped by external trade and inventory dynamics, not by a uniformly strong domestic-demand boom.
Inflation is the clearest H2 headwind
Eurostat’s August flash estimate puts headline HICP inflation at 3.3%, up from 2.9% in July, with energy inflation at 14.3%. That is consistent with the ECB’s June warning that the Middle East-related energy shock could weaken real incomes, confidence, and domestic demand. The same ECB baseline still projects 0.8% real GDP growth for 2026.
The labour market and surveys are not recessionary
Euro-area unemployment was 6.4% in July, unchanged from June. Meanwhile, the European Commission’s August survey showed the Economic Sentiment Indicator at 98.4 and Employment Expectations at 98.9, both near the long-run reference level of 100. This is why I do not assign much probability to the contraction bracket despite the energy shock.
What the Market May Be Underestimating
First, annual-average math. Traders can focus too heavily on the latest quarterly growth rate. A stronger Q2 level can mechanically lift the full-year average even if Q3 and Q4 are softer. That is the main reason I think the 1.0–2.0% contract deserves substantial weight despite a sub-1% forecast consensus.
Second, the exact-boundary rule. A published 1.0% is not neutral: it belongs to the higher bracket. Around a market this tight, that contract detail is economically meaningful.
Third, forecast timing. The ECB’s next macroeconomic projections are scheduled for 10 September 2026, just two days after this snapshot. A revised 2026 growth estimate could move the market materially, especially because the latest Eurostat Q2 estimate was published after the June projection round.
Bull/Bear Case for Major Outcomes
0–1.0% bull case
Energy prices stay elevated, inflation remains above target, consumer confidence remains weak, and Q3–Q4 growth slows enough that full-year annual GDP lands below 1.0%. The 0.8–0.9% institutional forecasts broadly hold.
0–1.0% bear case
Q2’s stronger estimate is not a one-off, fiscal and defence spending support activity, exports remain helpful, and resilient employment prevents a material consumption slowdown. Full-year growth reaches at least 1.0%, sending resolution to the upper bracket.
1.0–2.0% bull case
Recent GDP strength carries into the second half or produces enough annual-average carryover to reach the threshold. An exact 1.0% print is sufficient because the contract assigns boundary values to the higher range.
1.0–2.0% bear case
The energy shock proves persistent, real-income growth weakens, business investment softens, and the latest Q2 strength is partly reversed by later quarters. Full-year growth then stays closer to the 0.8–0.9% institutional baseline.
Risks and Uncertainties
- Revision risk before resolution: Q3 and Q4 data can change the annual average materially.
- Flash-release risk: Polymarket uses the initial referenced Q4 flash release even if subsequent Eurostat revisions change the historical series.
- Fallback-rule risk: if the annual figure is absent, the contract can resolve from a quarterly year-on-year rate instead.
- Energy/geopolitical risk: the duration and intensity of the energy shock can shift both inflation and real growth.
- Irish GDP volatility: multinational activity can create large swings in the aggregate euro-area series, a point the ECB explicitly discusses in its projections.
- Market microstructure: the headline probability and executable buy prices are not identical; spreads and limited liquidity can distort a simple probability reading.
PredictBoy Probability Assessment
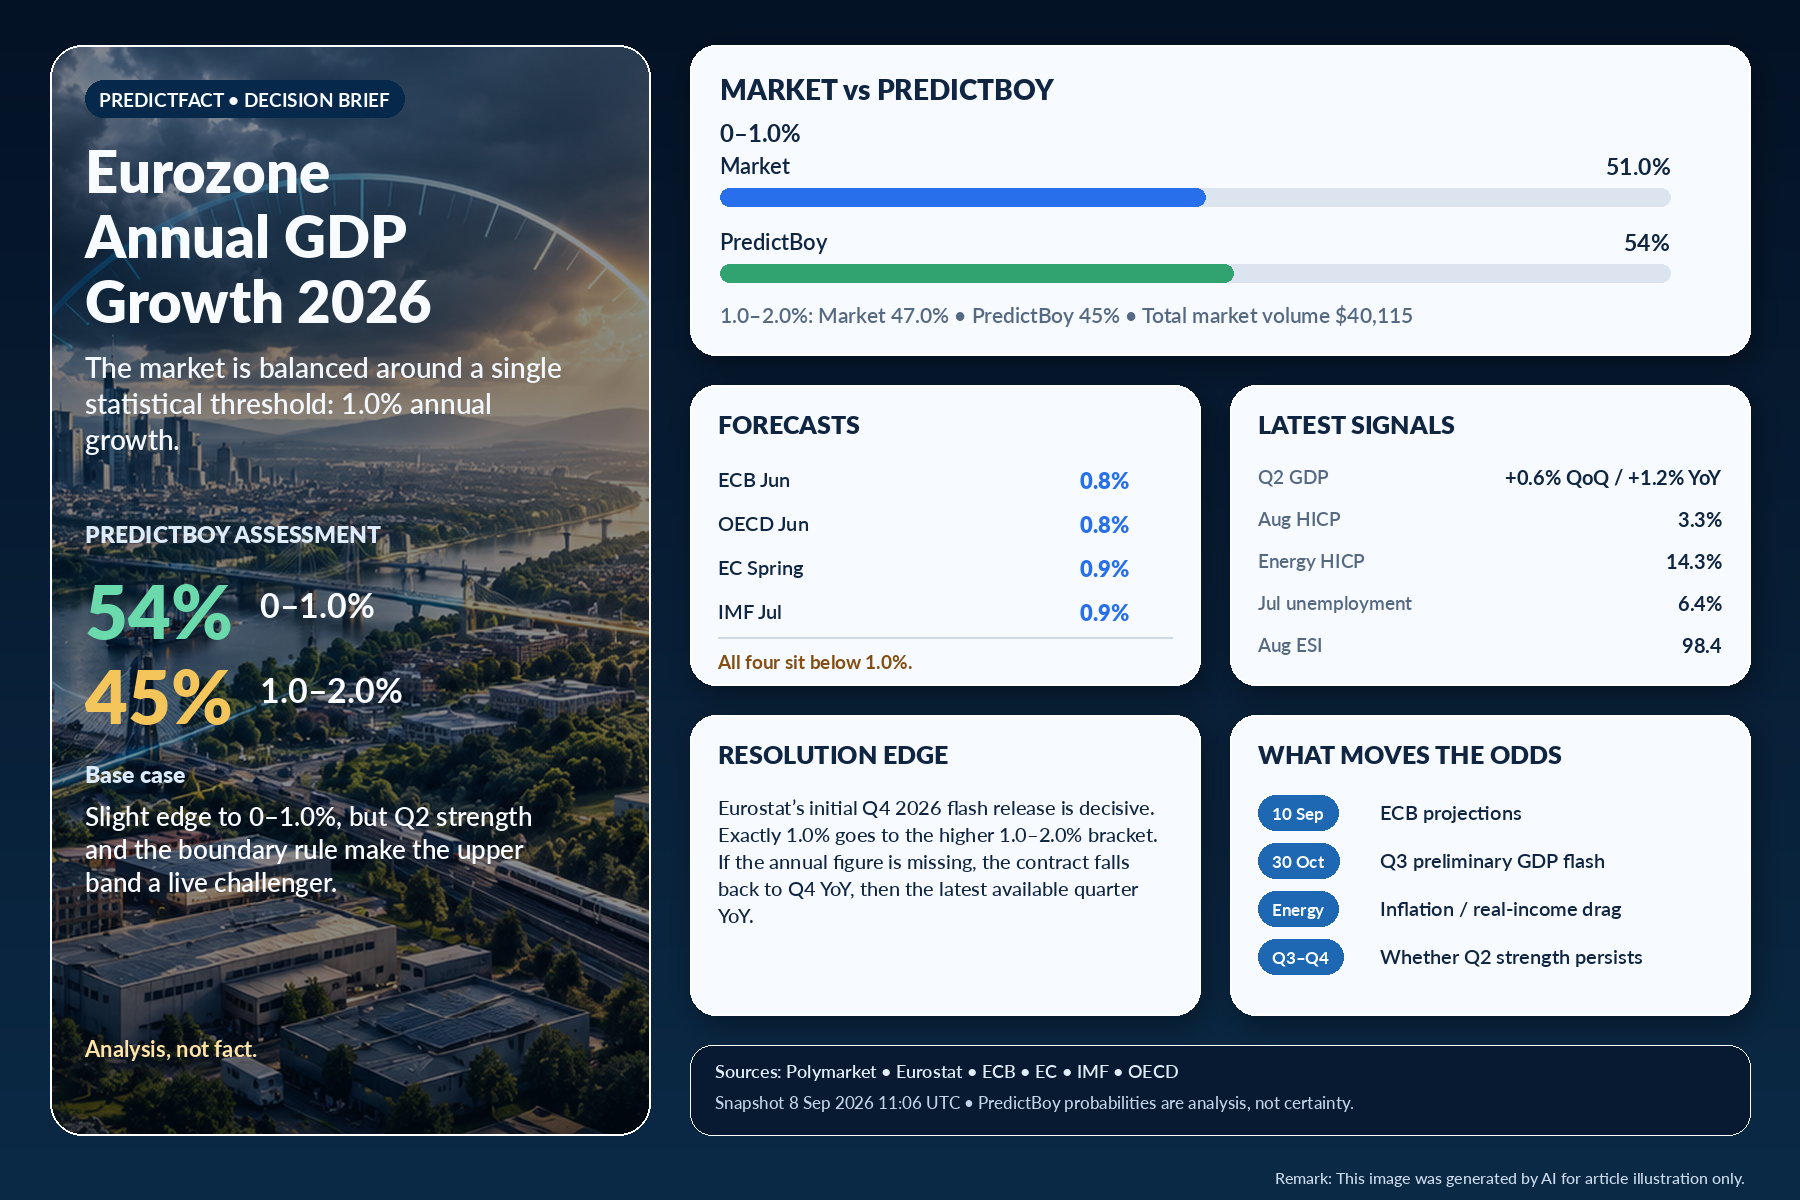
- 0–1.0%: 54%
- 1.0–2.0%: 45%
- All other listed ranges combined: 1%
Primary factors: forecast cluster, latest GDP momentum, and energy/inflation drag.
Secondary factors: labour-market resilience, business/consumer sentiment, and the exact-boundary resolution rule.
Overall probability outlook: a genuine near-coin-flip centered on 1.0%, with a modest lower-band edge rather than a high-confidence call.
Market Odds vs. PredictBoy
| Outcome | Polymarket headline | PredictBoy | Difference |
|---|---|---|---|
| 0–1.0% | 51.0% | 54% | PredictBoy +3.0 pp |
| 1.0–2.0% | 47.0% | 45% | PredictBoy −2.0 pp |
| All other ranges | Each individual band around 1% or less | 1% combined | Not directly comparable because Polymarket outcomes are separate binary books and rounded |
The difference is small enough that I would treat the market and my framework as broadly aligned: both say the real question is whether the annual result lands just below or at/above 1.0%. My only meaningful disagreement is a slight preference for the lower bracket because the major forecasts remain clustered below the line.
What Could Change Before Resolution
- 10 September 2026: the ECB is scheduled to publish new macroeconomic projections. A 2026 growth revision toward or above 1.0% would be an important market catalyst.
- 30 October 2026: Eurostat’s preliminary flash estimate for Q3 GDP is scheduled, giving the first hard read on whether Q2 momentum persisted.
- Autumn 2026: inflation, energy prices, consumer confidence, industrial activity, and labour-market data will help determine whether the H2 slowdown is mild or severe.
- January 2027: the initial Eurostat Q4 GDP and employment flash release is the contract’s intended resolution source.
Final Take
PredictBoy analysis: I give 0–1.0% a narrow 54% edge, with 1.0–2.0% at 45% and all other ranges combined at 1%. The lower bracket has the better forecast support; the upper bracket has the better recent-momentum argument and owns the exact 1.0% boundary.
This is not a market where I would describe either central outcome as clearly mispriced. The most important near-term checkpoint is the ECB’s 10 September projection update, followed by the Q3 flash GDP release. Until those arrive, the evidence supports a close race around a single decimal-place threshold rather than a confident macro call.
Sources
- Polymarket — Eurozone Annual GDP Growth 2026 (market odds, outcome volumes, resolution rules; snapshot 8 September 2026, 11:06 UTC (18:06 ICT))
- Eurostat — GDP main components and employment estimates for Q2 2026 (7 Sep 2026)
- Eurostat — August 2026 HICP flash estimate (1 Sep 2026)
- Eurostat — July 2026 unemployment (1 Sep 2026)
- ECB — June 2026 Eurosystem staff macroeconomic projections
- European Commission — Spring 2026 Economic Forecast
- IMF — Euro Area 2026 Annual Consultation / July 2026 forecast
- OECD — Euro Area Economic Snapshot / June 2026 projection
- European Commission — August 2026 business and consumer surveys